From Pavement to Plaza: Traffic Data Shows Portland’s SE 7th & Sandy Pop-Up Plaza Boosted Cycling and Slowed Drivers While Vehicle Volumes Held Steady
Three rooftop Traffic Monitors, 57 days, more than a million roadway events — the evidence behind Depave’s Central Eastside green plaza.
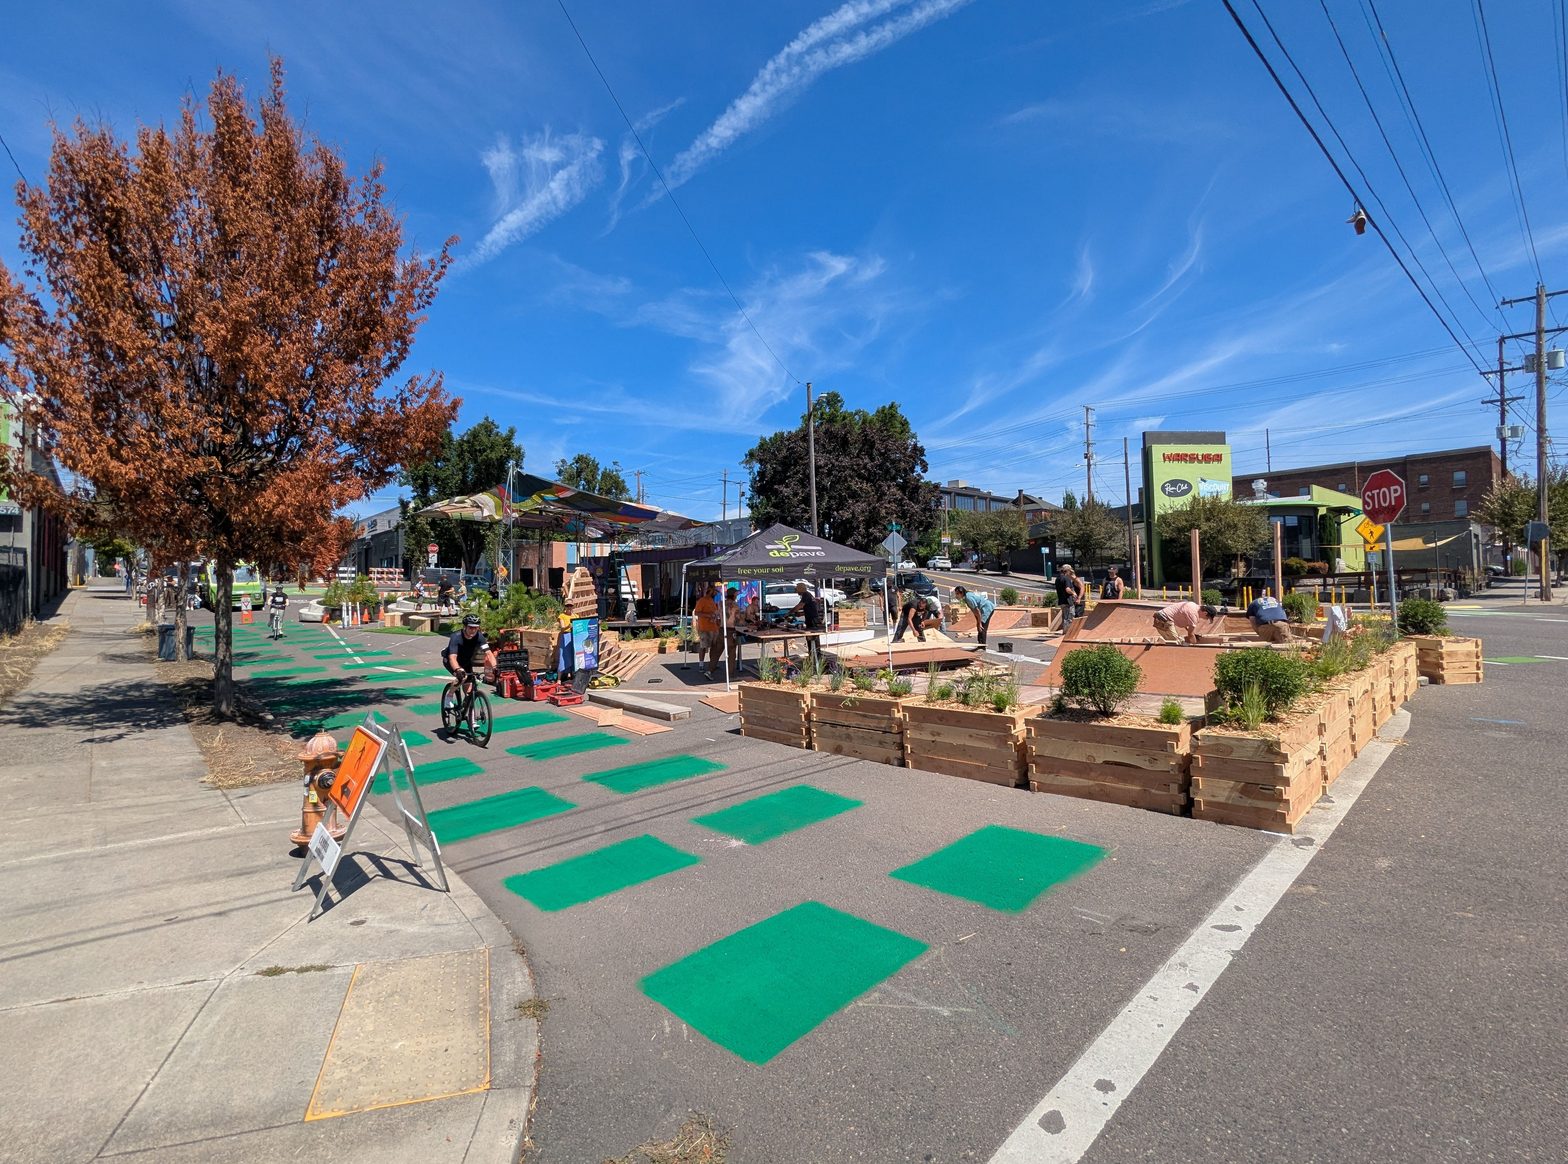
An over-paved five-way intersection, and a vision to green it
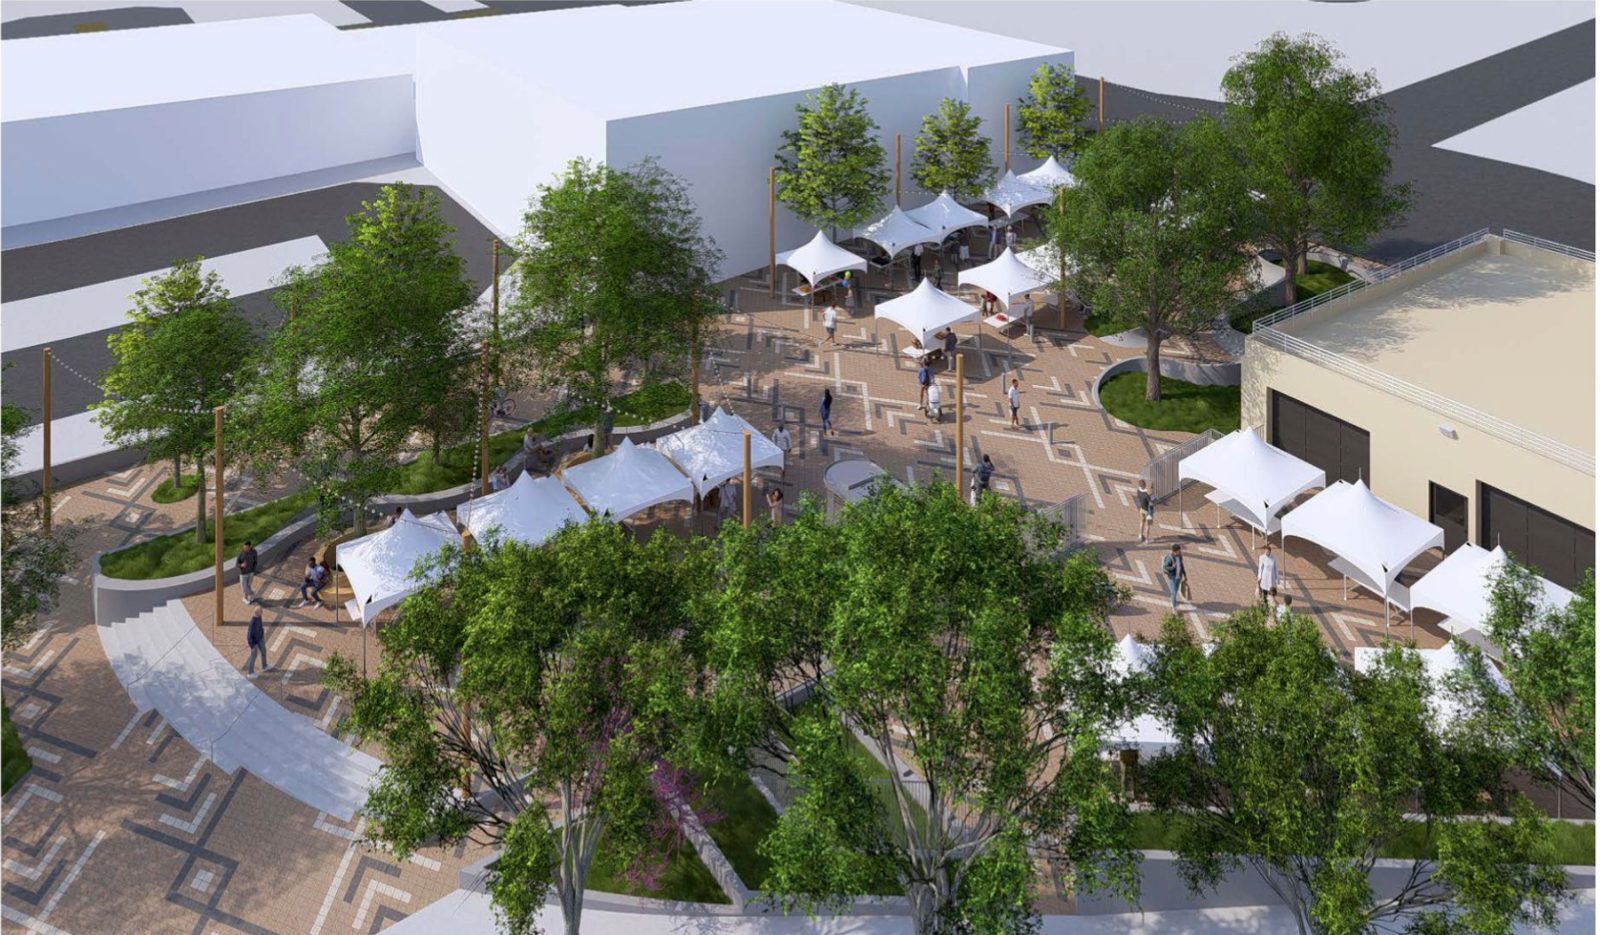
The meeting of SE 7th Avenue, Sandy Boulevard, and Washington Street in Portland’s Central Eastside is roughly 85% impervious surface. It sits at the nexus of three High Crash Corridors, carries the 7th Avenue Neighborhood Greenway south from the Blumenauer Bridge, and sends vehicles downhill through an unclear, over-wide crossing where pedestrians, bicycles, scooters, and electric wheelchairs all share ambiguous space. The Central Eastside has some of the city’s hottest surface temperatures, among its least tree canopy, and little park access — even though it is zoned for dense housing.
Depave, the Portland nonprofit that has transformed 82 paved sites into green space since 2008, is leading an effort to turn the excess pavement into a green community plaza: traffic calming, placemaking, and stormwater infrastructure in one project, designed with businesses, nonprofits, designers, and City staff. In August 2025 Depave and partners installed a temporary pop-up plaza — painted surface, planters, and seating — to let the neighborhood try the idea before anything permanent is built.
Pop-ups are good at generating enthusiasm. They are less good at generating evidence. City bureaucracies don’t run on good vibes; they run on data. So Depave sponsored a Roadway Biome deployment to answer the question every tactical-urbanism project eventually faces: did it actually work?
Roadway Biome placed three TrafficMonitor.ai devices on nearby rooftops before the plaza went in, kept them running through the six-week pop-up, and left them in place for weeks after it came out. The result is a before/during/after record of every bicycle, pedestrian, and vehicle moving through the intersection — with radar speeds and air-quality readings alongside.
What Depave projects deliver. Rainwater infiltration that reduces combined sewer overflows and flooding; asphalt removed and tree canopy added, lowering surface temperatures people can feel and NASA can measure; volunteer events that build community; inclusive contracting for small businesses; and nature exposure in neighborhoods that have the least of it.
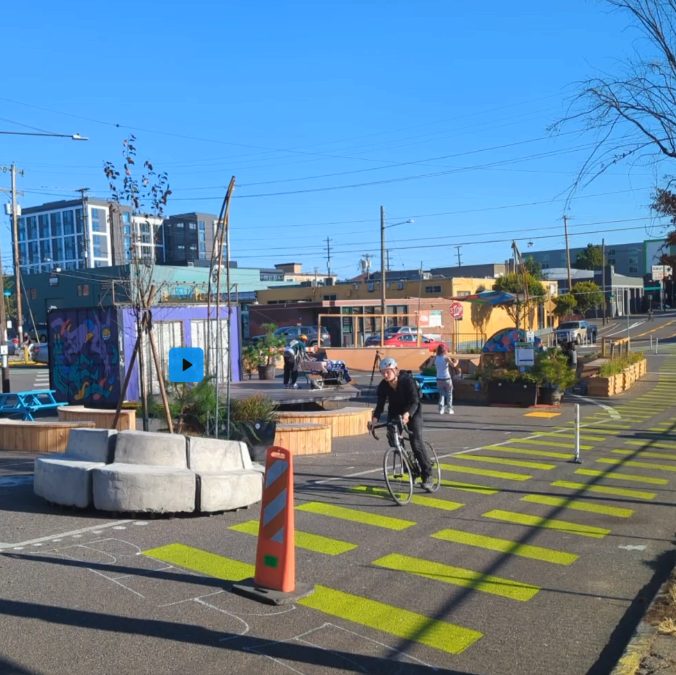
Watch the presentation
Matt Zajack walks through the study — the measurement problem, the deployment, and the bike-boom and calming-effect results — in the “From Pavement to Plaza” talk.
Privacy note: nothing is loaded from YouTube until you click play, and the video then plays from YouTube’s privacy-enhanced domain.
Eyes on the street: 57 days, three rooftops
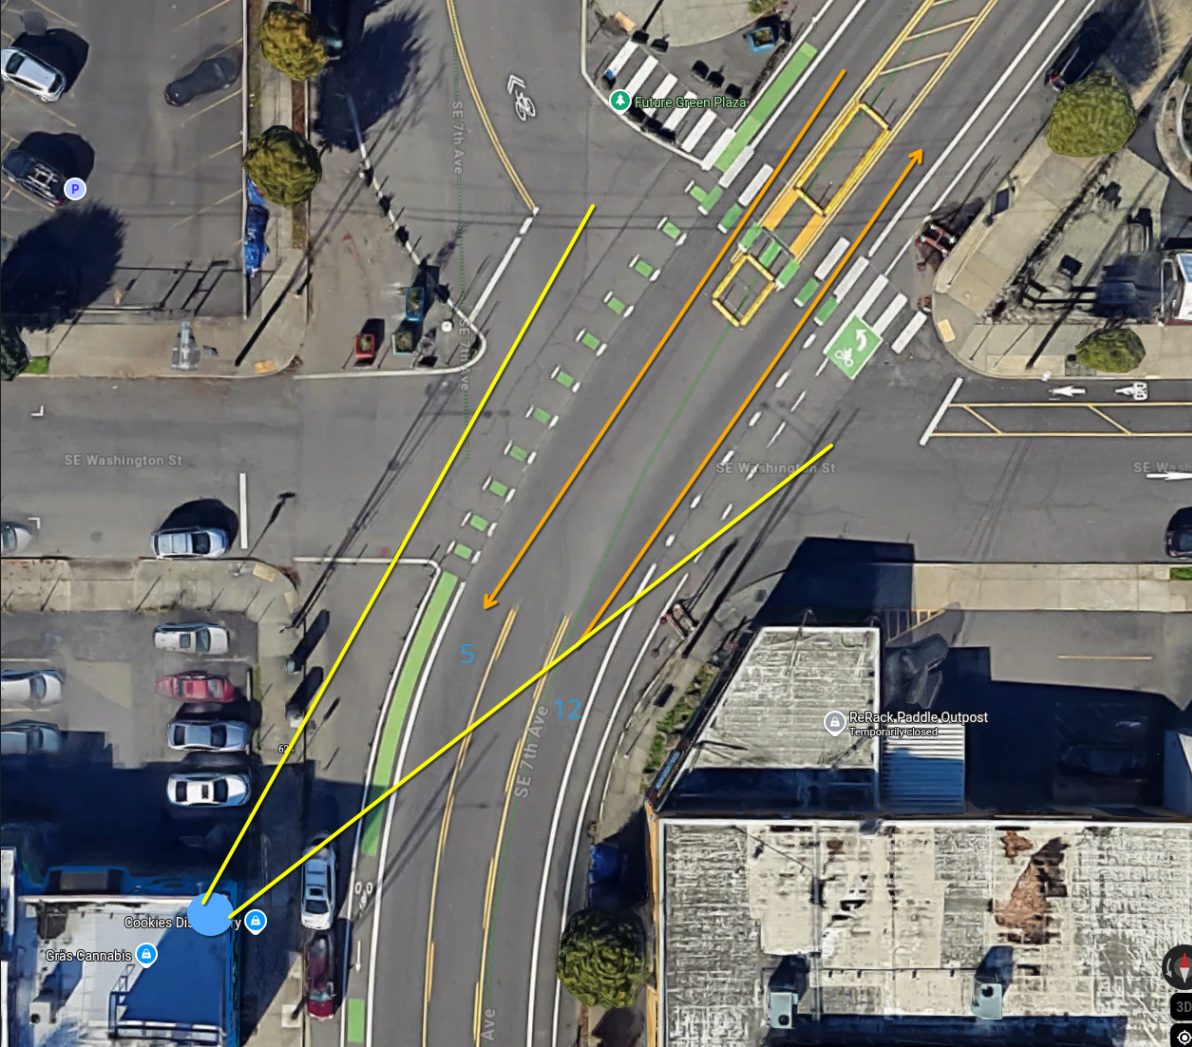
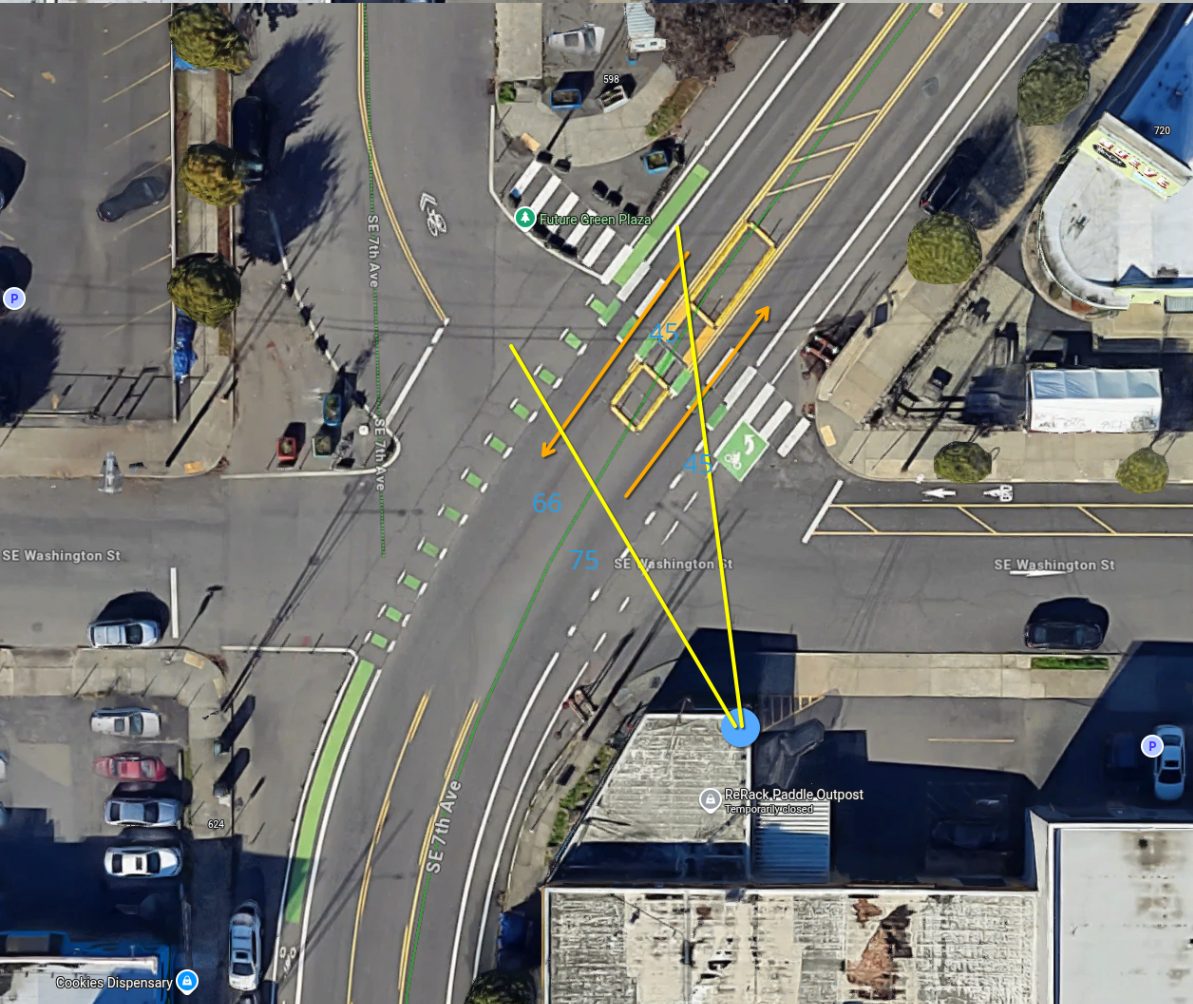
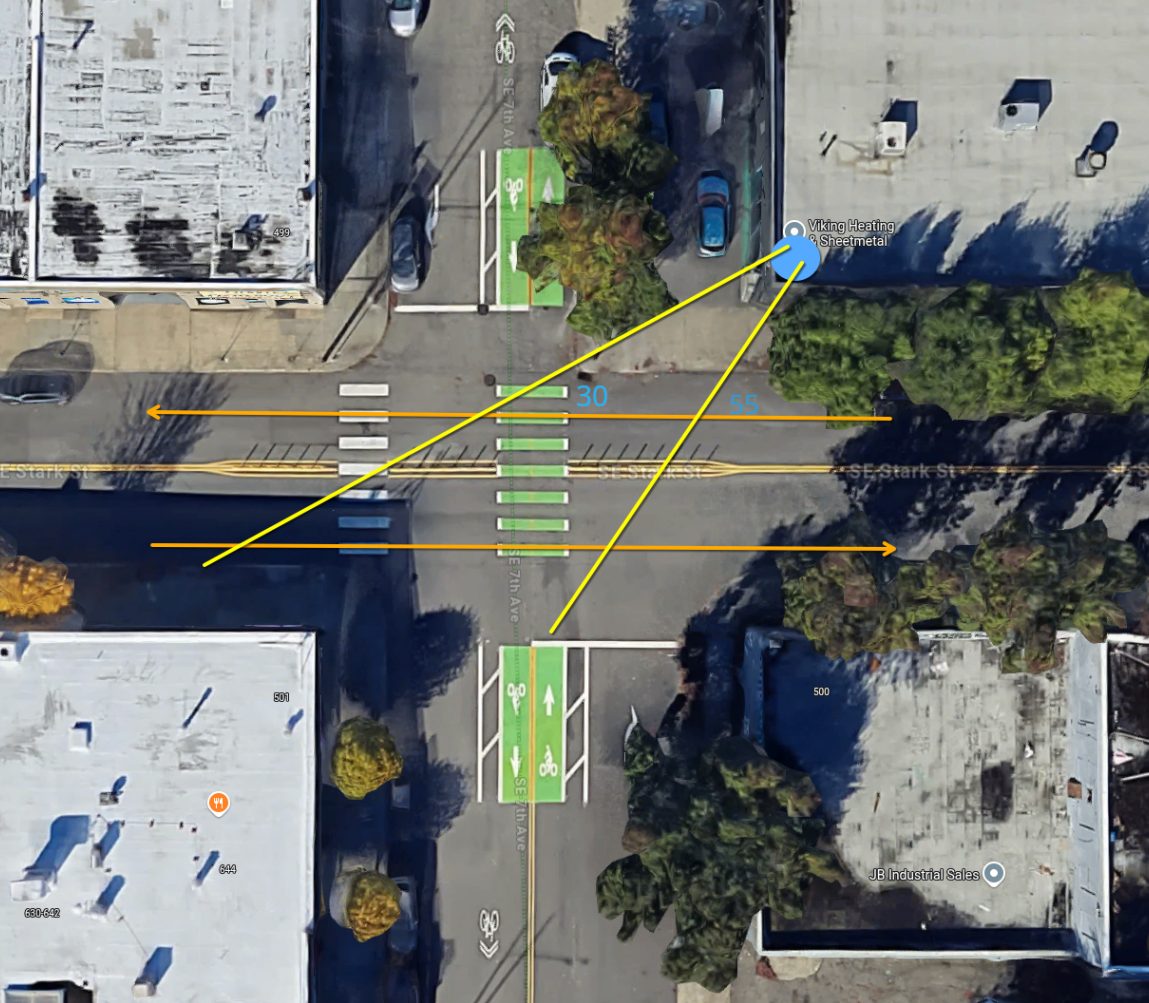
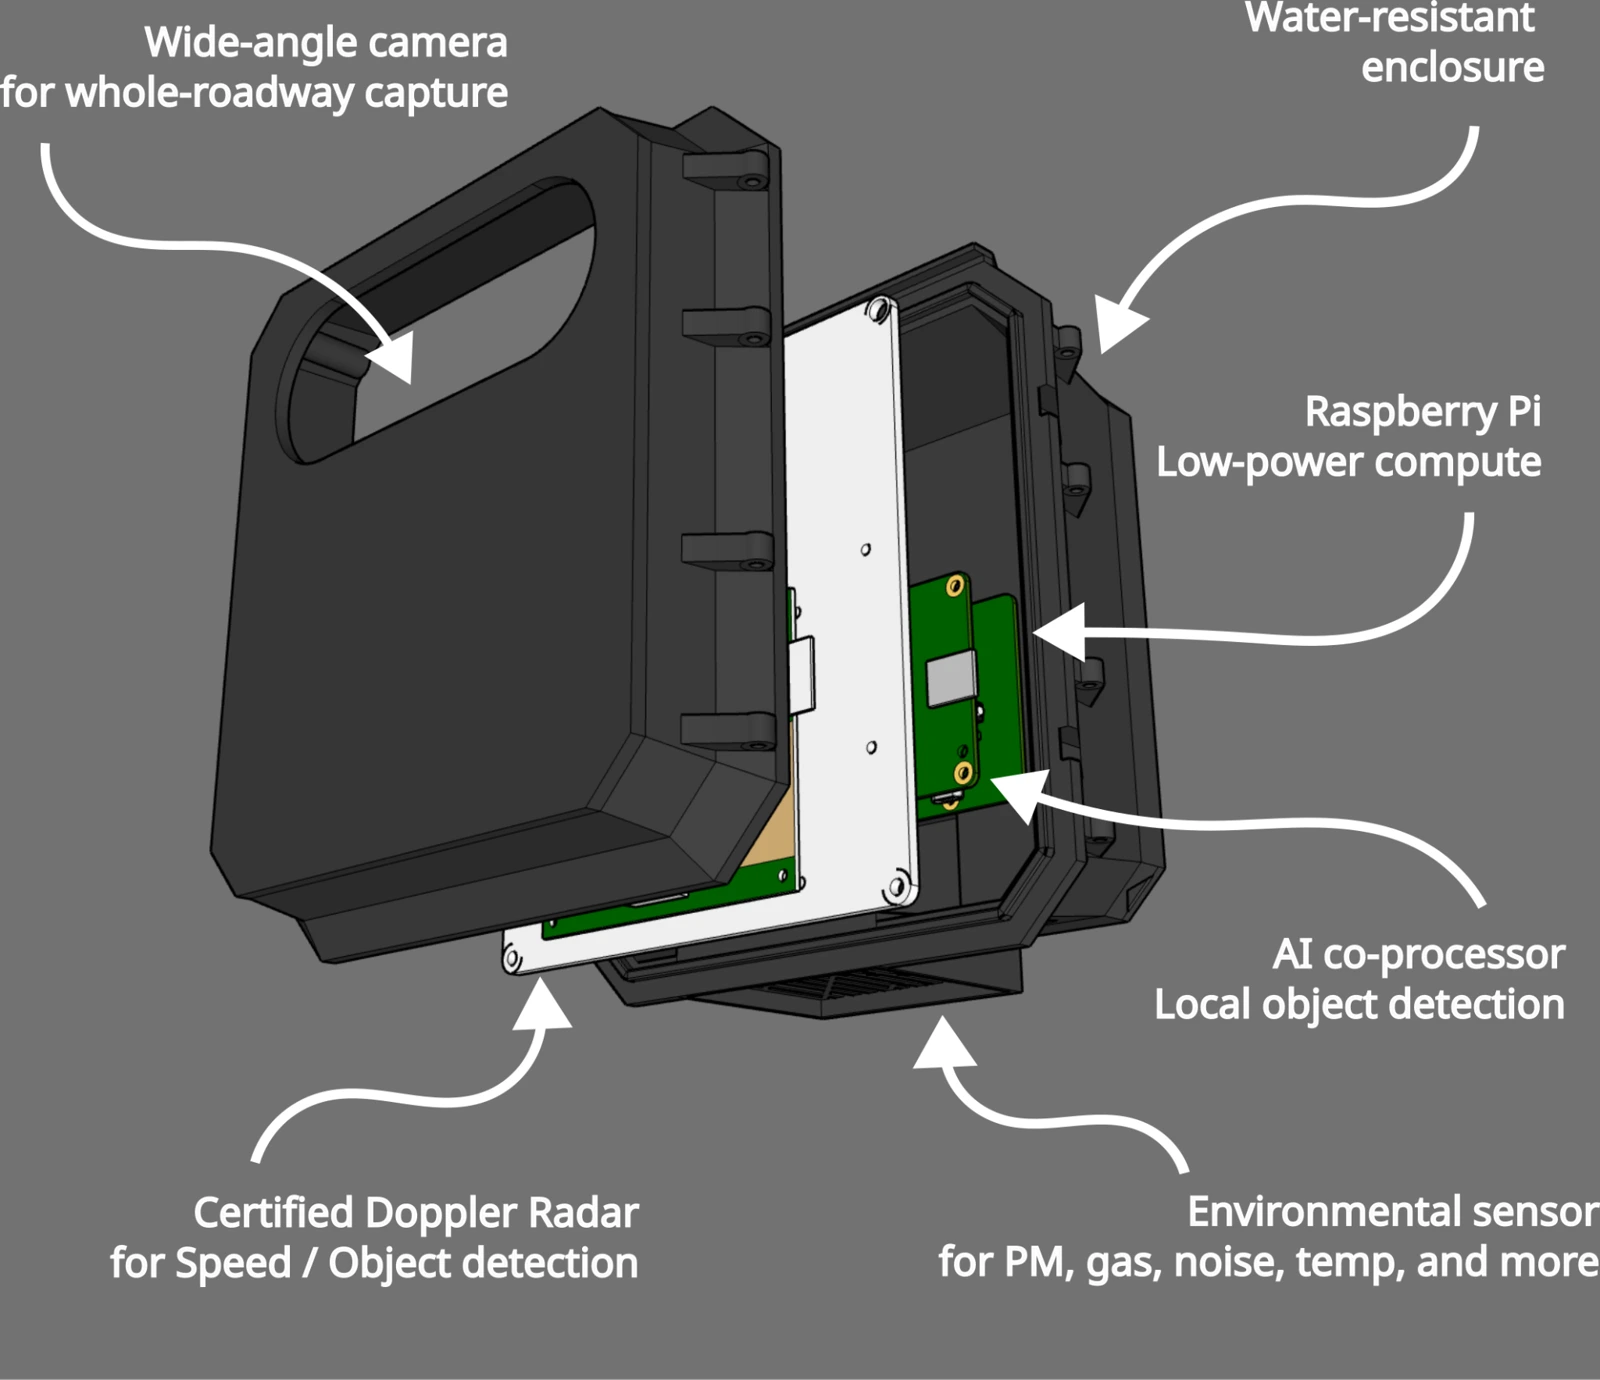
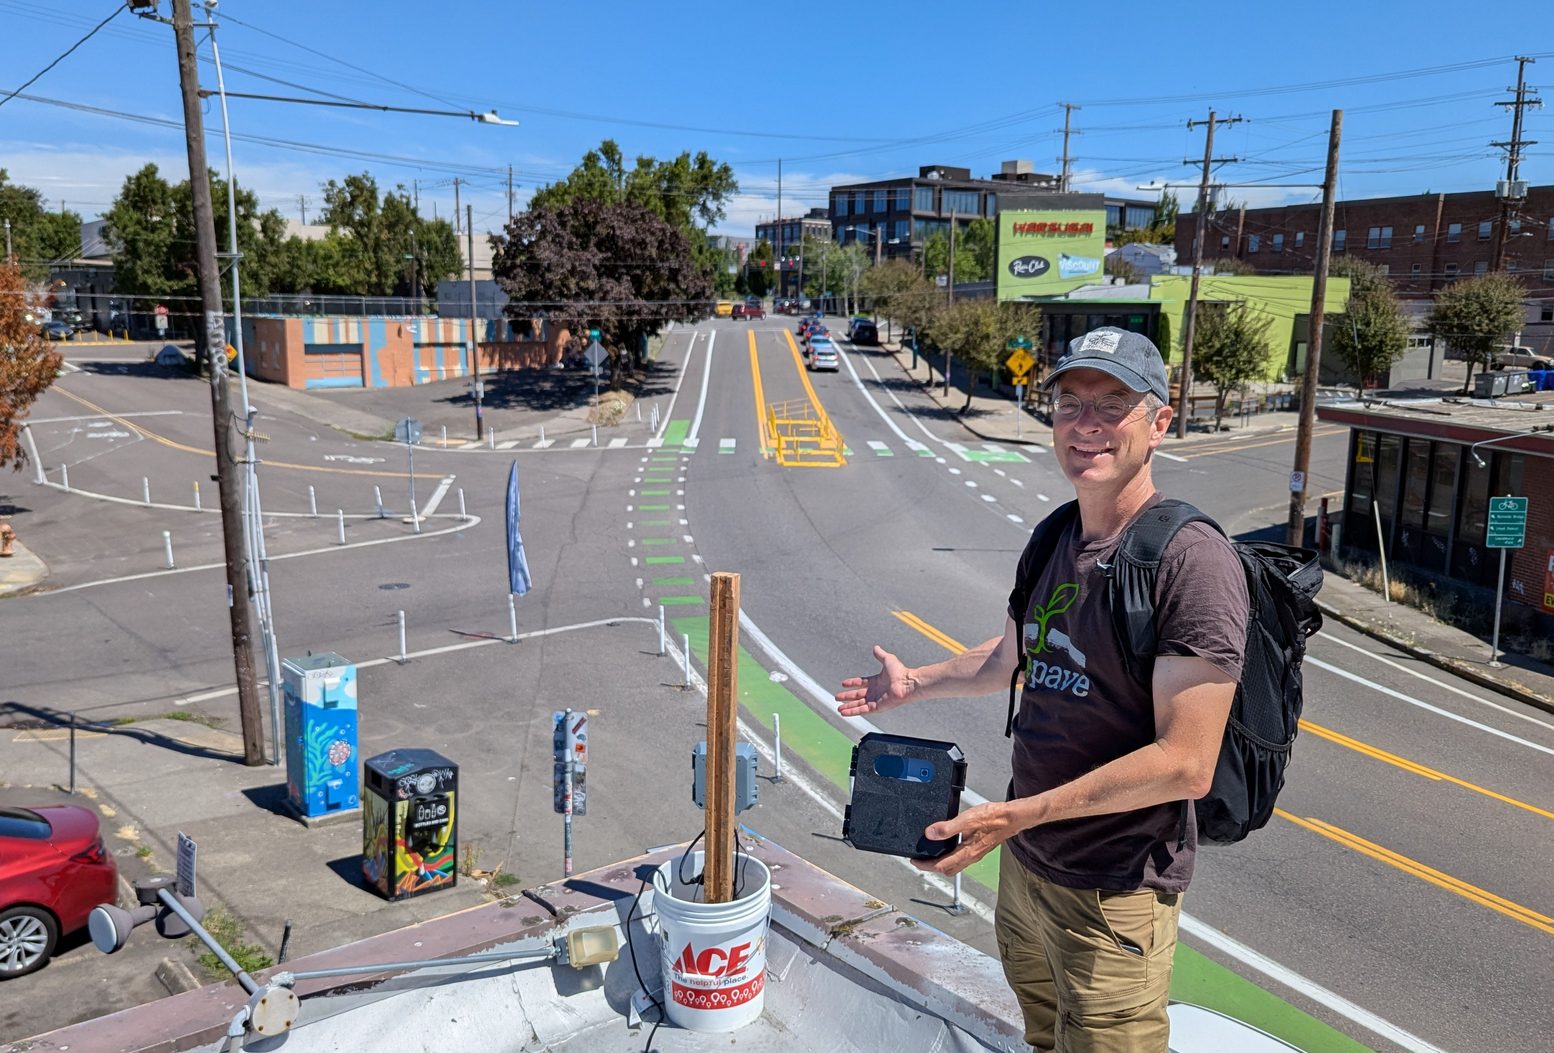
In a single afternoon, three Traffic Monitors were installed on the roofs of private buildings — with each owner’s permission — giving overlapping views of the plaza intersection and a third view one block north at 7th & Stark, the busiest bicycle crossing in the area. Each device counts bicycles, pedestrians, and vehicles with on-device machine learning, measures speed with Doppler radar, tracks direction and turning movements through user-defined zones, and samples air quality every five minutes.
(Replace this block with the intern’s map.)
| Device | Host rooftop | View |
|---|---|---|
| 1 · dp-salal | Cookies | 7th/Sandy & Washington, SW corner, bearing N — looks downhill into the plaza intersection |
| 2 · dp-tuni | Next Adventure | 7th/Sandy & Washington, NE corner, bearing NW — overlapping field of view with dp-salal |
| 3 · dp-snowberry | Viking Steel | 7th & Stark, NE corner, bearing SW — one block north on the greenway |
dp-salal and dp-tuni watch the same intersection from opposite corners; their counts are not additive. Counts in this report are reported per device.
Data-driven insights: a holistic count of everyone using the street
Municipal decisions about street space usually rest on one number: the car count from a pneumatic tube laid across the road for a few days. That single metric says nothing about the people walking and biking through the same space, nothing about speed, and nothing about how behavior changes when the street changes. Over 57 days the three Traffic Monitors logged more than 1.4 million detection events across all modes, enough to compare phases of the plaza and weekday versus weekend patterns with statistical confidence.
At the plaza intersection (dp-salal), average daily traffic was 347 bicycles, 887 pedestrians, and 7,200 vehicles. One block north at 7th & Stark, pedestrian volumes were nearly three times higher (2,461 per day) and bicycles peaked at 480 per weekday — confirming the greenway’s role as a primary active-transportation corridor into the Central Eastside.
Average daily traffic (ADT) by device and plaza phase
| Mode | Days (n) | Detection events | ADT (overall) | ADT before plaza | ADT during plaza | ADT after plaza | ADT weekday | ADT weekend |
|---|---|---|---|---|---|---|---|---|
| dp-salal · 7th/Sandy & Washington (SW corner, bearing N) · Cookies | ||||||||
| Bicycle | 57 | 19,751 | 347 | 400 | 428 † | 264 | 382 ‡ | 264 |
| Pedestrian | 57 | 70,335 | 887 | 1,013 | 998 | 761 | 890 | 881 |
| Vehicle | 57 | 410,379 | 7,200 | 7,633 | 7,239 | 7,053 | 7,945 ‡ | 5,446 |
| dp-tuni · 7th/Sandy & Washington (NE corner, bearing NW) · Next Adventure | ||||||||
| Bicycle | 56 | 16,128 | 288 | 475 | 265 † | 254 | 305 | 245 |
| Pedestrian | 56 | 93,444 | 1,381 | 1,600 | 1,468 | 1,127 | 1,270 | 1,656 |
| Vehicle | 56 | 378,878 | 6,766 | 7,569 | 6,849 | 6,278 | 7,295 ‡ | 5,442 |
| dp-snowberry · 7th & Stark (NE corner, bearing SW) · Viking Steel | ||||||||
| Bicycle | 53 | 21,772 | 411 | 362 | 431 | 407 | 480 ‡ | 250 |
| Pedestrian | 53 | 152,227 | 2,461 | 292 | 2,880 † | 2,582 | 2,637 | 2,057 |
| Vehicle | 53 | 296,152 | 5,588 | 6,190 | 5,598 | 5,485 | 6,250 ‡ | 4,057 |
† Statistically significant difference (p ≤ 0.05) among plaza phases for the mode indicated. ‡ Statistically significant difference (p ≤ 0.05) between weekday and weekend for the mode indicated. Plaza active Aug 8 – Sep 20, 2025. dp-salal and dp-tuni fields of view overlap; counts are not additive.
Key findings: evidence that the plaza changed behavior
Insight 1 — The bike boom: if you build it, they will ride
Bicycle traffic at the plaza intersection was significantly higher while the plaza was in place than after it was removed: 428 versus 264 bicycles per day at dp-salal, a 62% difference. Vehicle volumes did not rise over the same period (7,239 during vs. 7,053 after), so the shift is not explained by a general increase in traffic. The device one block north at 7th & Stark recorded its highest bicycle counts during the plaza as well (431 per day).
The overlapping view from dp-tuni tells a more complicated story — it recorded its highest bicycle counts in the week before the plaza opened (475 per day) and similar volumes during and after. Because the two devices see the intersection from opposite corners and classify different approaches, the discrepancy is itself useful: it points to where riders were routing through the intersection, a question the turning-movement data below can answer.
Taken together, the plaza period shows the pattern transportation planners call induced demand for cycling: make a crossing feel safer and more people choose to ride through it.
Insight 2 — The calming effect: physical infrastructure changes speed
The speed limit on 7th/Sandy is 25 mph, and the intersection sits at the bottom of a downhill grade. With the plaza in place, 35% of vehicles exceeded 25 mph; after it was removed, 43% did. Every speed bin above 25 mph grew once the plaza came out, and the differences between the plaza and after-plaza phases are statistically significant. Bicycles followed the same pattern: 17% over 25 mph with the plaza, 23% without.
No enforcement, no signage campaign — paint, planters, and a narrower effective crossing were enough to move the distribution. That is the behavioral evidence advocates usually cannot produce for a temporary installation.
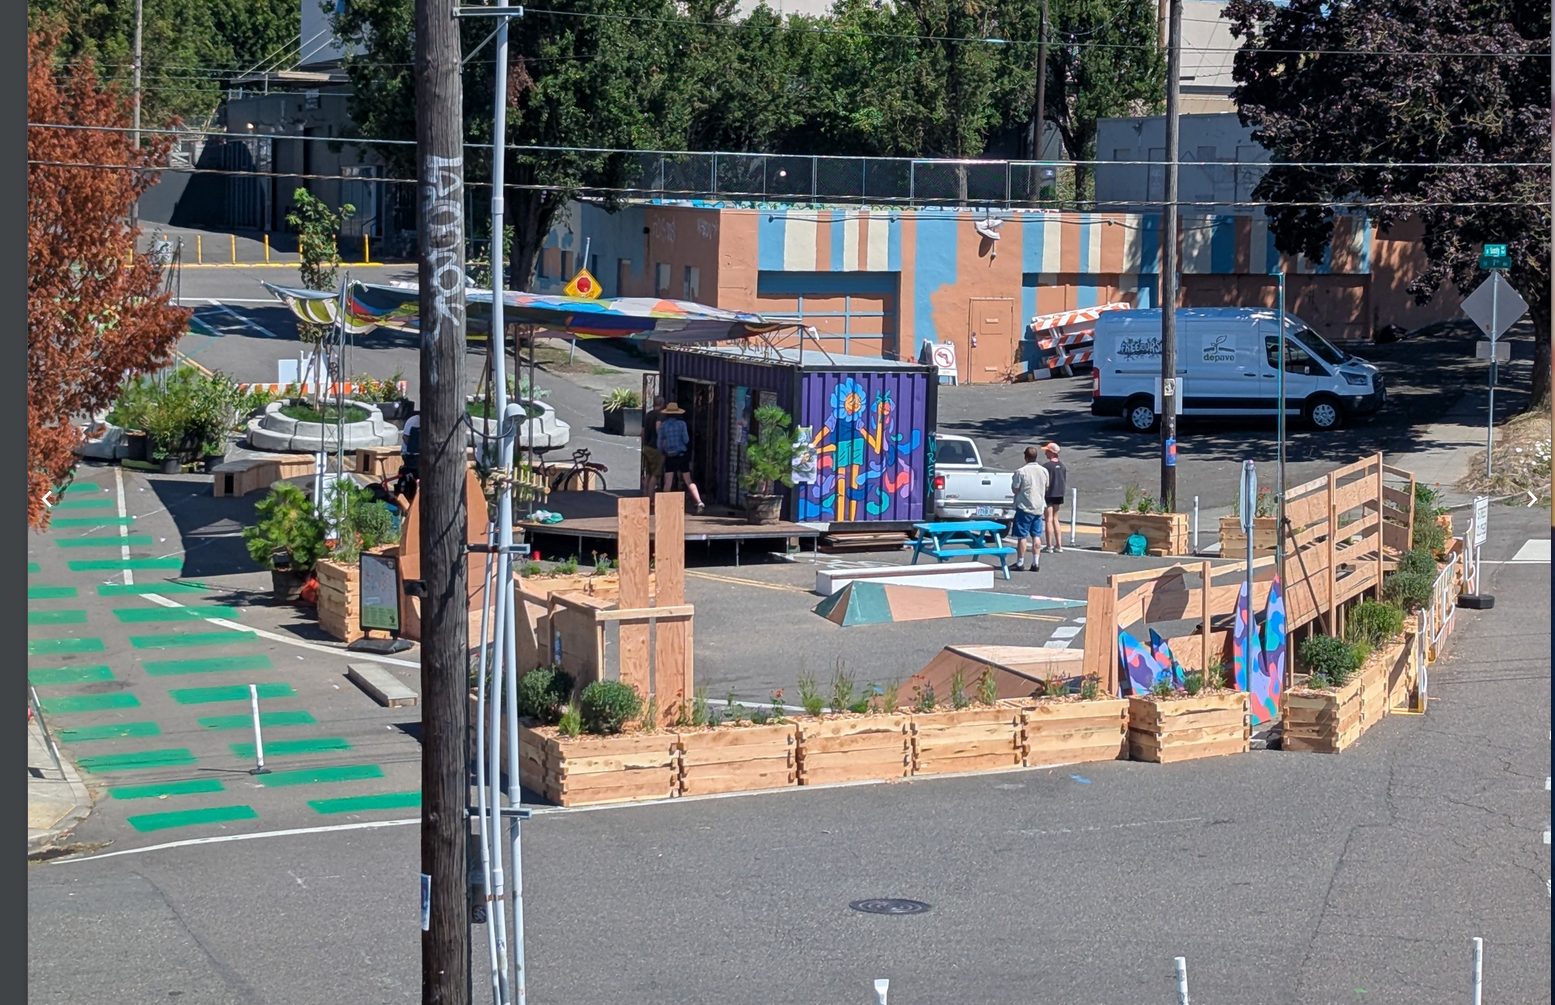 35% of vehicles > 25 mph
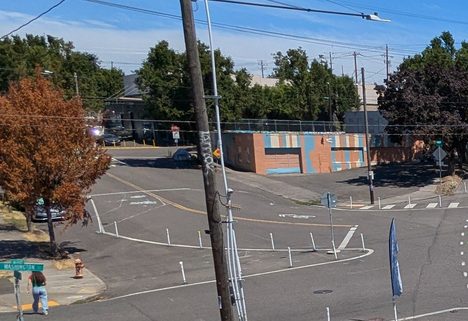 43% of vehicles > 25 mph
- Vehicles were not displaced. Daily vehicle volumes at the plaza intersection stayed within a few percent across all three phases (7,633 → 7,239 → 7,053). The plaza calmed traffic without pushing it elsewhere.
- Weekday commuting dominates bicycle use. Bicycles ran 382 per weekday vs. 264 per weekend day at the plaza, and 480 vs. 250 at 7th & Stark — a statistically significant commuter pattern that favors long-term, every-day investments over event programming.
- Downhill is where the risk is. Coming downhill through the intersection, 46% of vehicles and 23% of bicycles exceeded 25 mph; uphill, 21% and 11%. Any permanent design should concentrate its calming on the downhill approach.
- Pedestrian volumes point north. 7th & Stark carried ~2,500 pedestrians per day during the study, with weekend volumes at nearly 80% of weekday levels. The plaza block connects to a corridor people already walk.
Vehicle speed is the primary safety threat
Across the full study, 39% of all vehicles at dp-salal exceeded the 25 mph limit, and 3% exceeded 30 mph — roughly 200 vehicles every day traveling at speeds where a pedestrian struck has a substantially higher chance of fatal injury. Radar-measured speeds are captured for every detected object, so the same tables can be produced for bicycles, by direction, by phase, or by hour.
Speed distribution by plaza phase (dp-salal)
| mph | Bicycle (% of 13k) | Vehicle (% of 344k) | ||||
|---|---|---|---|---|---|---|
| Before | Plaza active | After | Before | Plaza active | After | |
| <10 | 9% | 26% * | 17% * | 7% | 5% | 5% |
| 10–15 | 18% | 14% * | 17% * | 6% | 6% | 6% |
| 15–20 | 20% | 16% | 16% | 10% | 13% * | 10% * |
| 20–25 | 32% | 27% | 27% | 39% | 42% * | 36% * |
| 25–30 | 20% | 15% * | 21% * | 35% | 32% * | 39% * |
| 30+ | 1% | 2% | 2% | 3% | 3% * | 4% * |
Percent of each mode in each speed bin during each phase. * Statistically significant difference between the plaza-active and after-plaza phases within that speed bin for that mode. Shaded rows are over the 25 mph limit.
Speed distribution by direction (dp-salal, full study)
| mph | Bicycle (% of n) | Vehicle (% of n) | ||
|---|---|---|---|---|
| Downhill (8.6k) | Uphill (3.7k) | Downhill (252k) | Uphill (98k) | |
| <10 | 14% | 36% | 5% | 6% |
| 10–15 | 16% | 15% | 4% | 11% |
| 15–20 | 17% | 16% | 7% | 20% |
| 20–25 | 30% | 22% | 37% | 43% |
| 25–30 | 21% | 10% | 42% | 19% |
| 30+ | 2% | 1% | 4% | 2% |
Downhill is inbound toward the plaza intersection (bearing N from dp-salal). Overall, 46% of vehicles and 23% of bicycles exceeded 25 mph coming downhill. Shaded rows are over the 25 mph limit.
Overall speed distribution (dp-salal, full study)
| mph | Bicycle | Vehicle |
|---|---|---|
| <10 | 21% | 5% |
| 10–15 | 16% | 6% |
| 15–20 | 16% | 11% |
| 20–25 | 28% | 39% |
| 25–30 | 18% | 36% |
| 30+ | 2% | 3% |
Percent of each mode in each speed bin across all 57 days. Shaded rows are over the 25 mph limit.
Time-of-day and weekday/weekend patterns
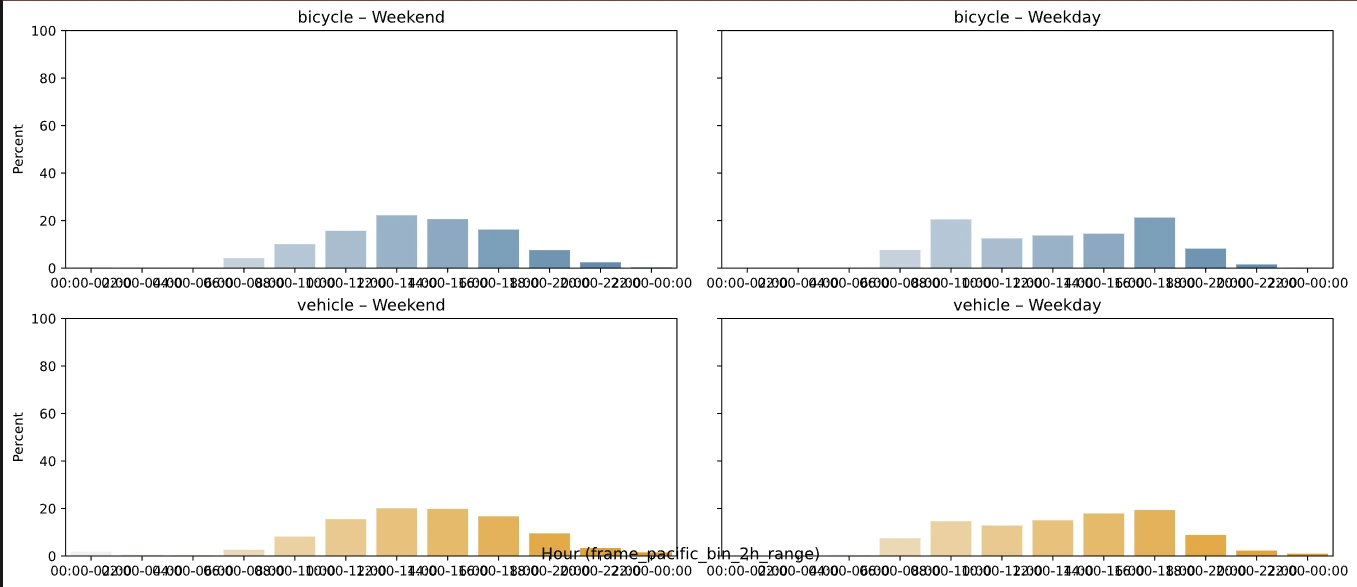
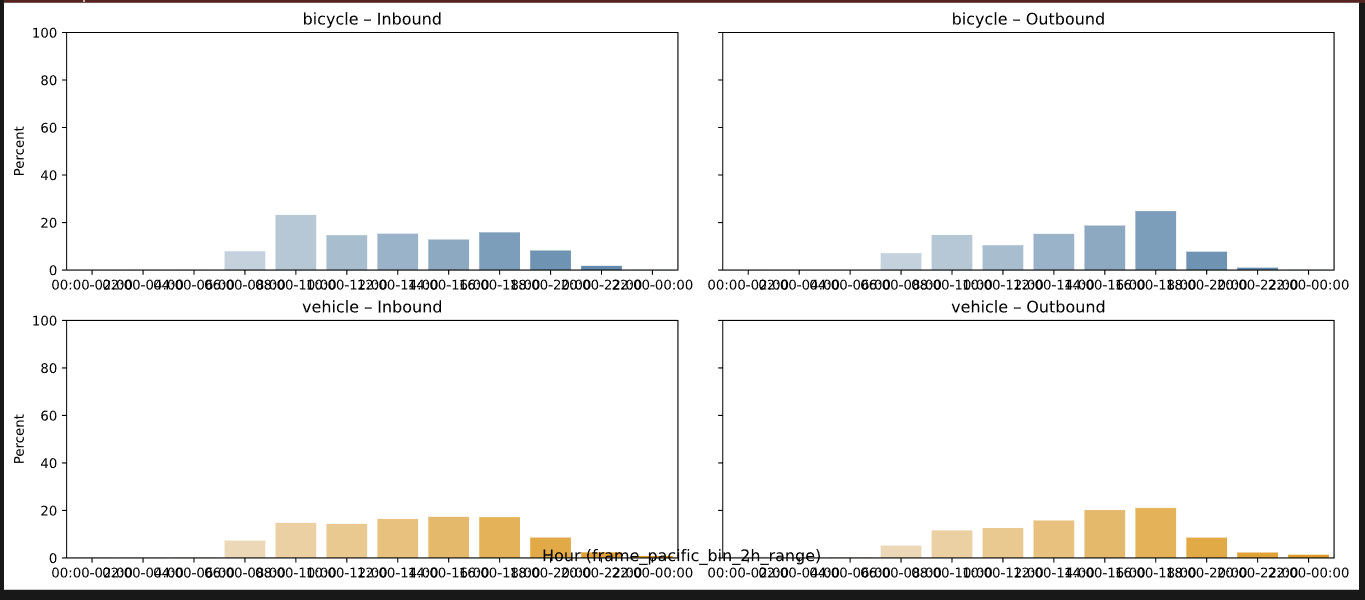
Bicycles behave like commuters. On weekdays, 15% of all bicycle volume — 30% of inbound (downhill) trips — passes between 8 and 10 am, and the outbound (uphill) peak at 4–6 pm carries 35% of outbound trips. Weekend bicycle traffic is lower and spread across the day.
Vehicles are steady all day. Volumes are fairly even across weekday hours with only a slight skew toward the 4–6 pm peak, and weekends run roughly 30% lighter. For a plaza that will reallocate space from vehicles to people, that flat profile matters: there is no single hour where the street is at capacity.
Movement and turning patterns
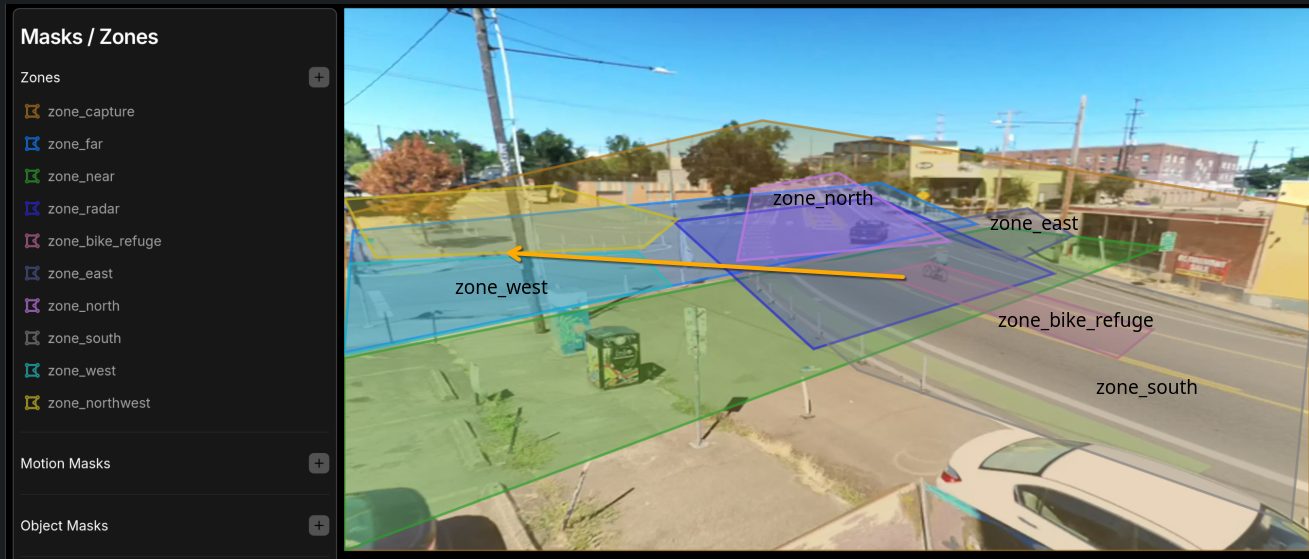
Every detection records the zones an object entered and in what order, so turning movements come for free. Patterns Depave’s design team can now investigate include use of the bike refuge on 7th/Sandy at Washington by northbound bicycles, the volume of vehicle turns into Washington from both directions on 7th/Sandy, and bicycle cross-traffic at 7th & Stark — the highest-volume bicycle crossing in the study.
The freight factor: measuring industrial friction instead of arguing about it
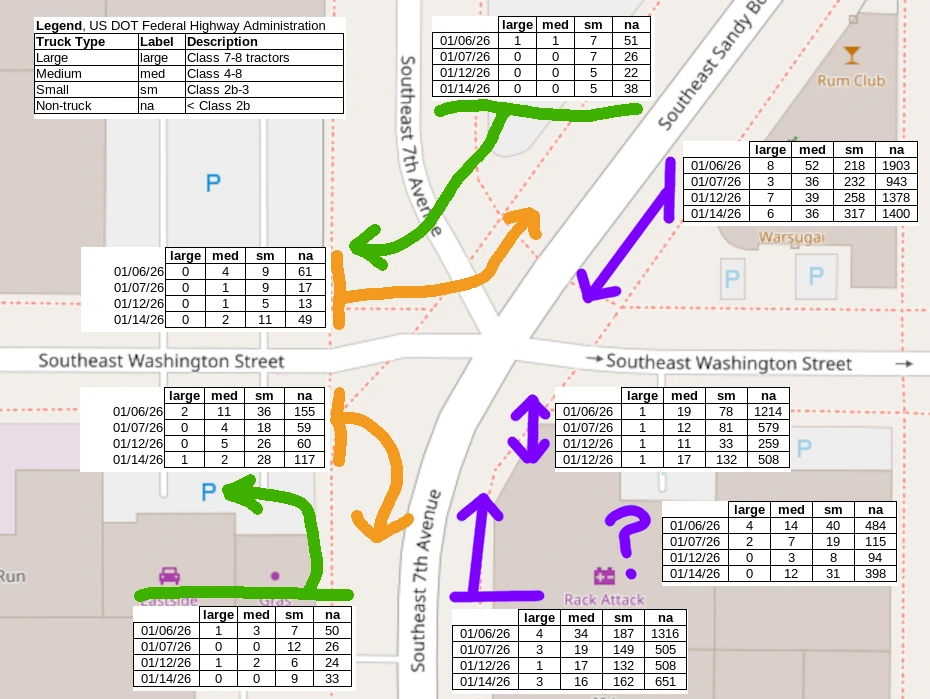
The Central Eastside is an industrial sanctuary, and any change to its streets raises the question of truck access. Rather than debate it, Roadway Biome classified every vehicle by truck type using U.S. DOT Federal Highway Administration classes over four weekdays in January 2026 and mapped each one’s turning movement through the intersection.
On a typical weekday (Jan 6, 2026), 6,227 vehicles passed dp-salal. Medium and large trucks — box trucks, delivery vans, and bigger — numbered 165, about 2.5%. Only about 5% of all turning movements (about 6% of truck movements) would be affected by the proposed plaza design. That works out to roughly nine large trucks per day making a movement the design would change.
We spend all this time and design worried about nine large trucks per day?Roadway Biome, “From Pavement to Plaza” presentation, 2026
From the planning question to a measured answer took one day with one device. Freight concerns are legitimate; now they are also quantified, and the design can accommodate the handful of movements that matter.
| Truck type | Label | FHWA description |
|---|---|---|
| Large | large | Class 7–8 tractors |
| Medium | med | Class 4–8 straight trucks |
| Small | sm | Class 2b–3 |
| Non-truck | na | < Class 2b |
Environmental justice: it’s not just traffic, it’s the air
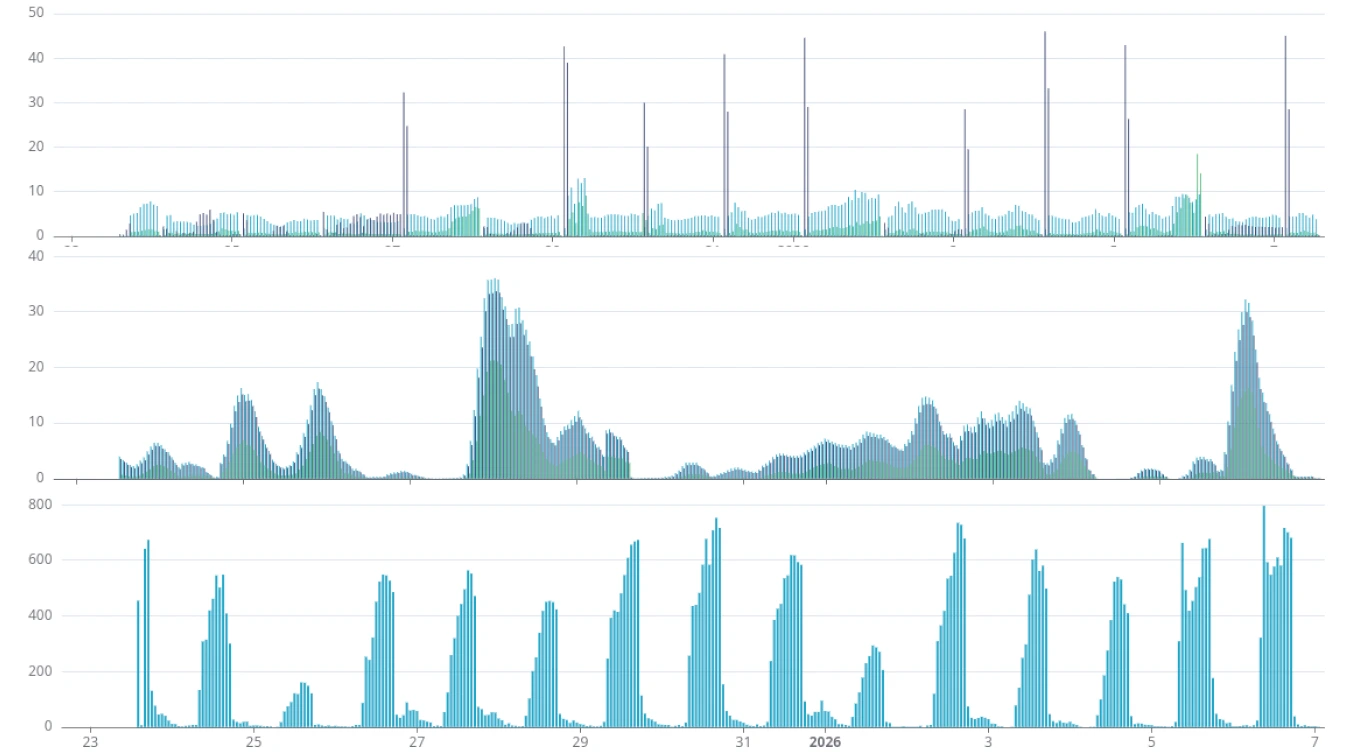
Each Traffic Monitor carries an environmental sensor stack sampled every five minutes: a PMS5003 particulate sensor (PM1, PM2.5, PM10), a MICS6814 gas sensor (reductive, oxidative, and ammonia gases), and a BME280 for temperature, pressure, and humidity. A MEMS microphone for noise is on board but was not enabled for this study.
Because the readings sit next to the vehicle counts in the same dataset, air quality can be read against traffic directly. Even the first look raises questions worth pursuing: how PM2.5 trends relate to the daily vehicle peaks, and an apparent overnight upsurge in oxidative gases that traffic alone would not explain. The full environmental analysis is pending; the data are already public on the device dashboards.
The value of rapid, affordable, holistic data collection
Municipal street reallocations often fall into what we call the single-metric trap: traditional pneumatic tube counters prioritize car volumes, so car volume becomes the only thing the decision can weigh. Tactical urbanism, meanwhile, relies on good feelings — photos of a busy pop-up and a stack of comment cards. Neither moves a bureau.
This study shows a replicable alternative. Three sites were set up in one afternoon. The entire implementation cost less than $3,000 for long-term monitoring. Each device captured roughly half a million events in 57 days with minimal intervention. And the output is granular, event-level, de-identified data that Depave, the City, and the public can all inspect — not a summary PDF from a consultant.
The advocacy loop
Strategic advocacy requires moving beyond simple counts to the behavioral shifts that prove a safety intervention worked. For SE 7th & Sandy, those shifts are now on the record: more cycling, slower driving, no loss of vehicle access, and a freight impact small enough to design around. Future work with Depave includes community activation around the data and continued monitoring as the permanent plaza design moves forward.
Methodology
Study design
Three TrafficMonitor.ai devices were installed on private rooftops with owner permission: Viking Steel at 7th & Stark (dp-snowberry), Cookies at 7th/Sandy & Washington (dp-salal), and Next Adventure at 7th/Sandy & Washington (dp-tuni). Data available from each device: object counts, direction and zone transitions, radar speeds, and air quality.
Timeframes
Study period Aug 1 – Nov 1, 2025; plaza active Aug 8 – Sep 20, 2025. Phases are compared as before, during, and after the plaza. Truck classification was run over four weekdays in January 2026. Statistical significance is reported at p ≤ 0.05.
Ground truth and fine-tuning
Citizen-science confirmation counts were performed on site by a volunteer (Ted) and compared with each device over the same window. Vehicle counts matched closely; bicycle and person counts diverged at the overlapping-view intersection, and those sessions were used to adjust detection zones, object thresholds, and minimum scores before the analysis was run — including the zone edits that enabled the turning analysis.
| Session | Counter | Bicycle | Person | Vehicle |
|---|---|---|---|---|
| 7th/Sandy & Washington | Ted (human) | 28 | 4 | 158 |
| dp-tuni | 15 | 20 | 155 | |
| dp-salal | 13 | 7 | 154 | |
| 7th & Stark | Ted (human) | 7 | 3 | 62 |
| dp-snowberry | 4 | 5 | 62 |
Roadway Biome capabilities: privacy by design
The Traffic Monitor is open source, glass-box, and repairable. Object detection runs on the device itself (edge inference), and only a de-identified event record leaves it: object class, time, zones entered, direction, and radar speed. No images, video, license plates, or faces are stored or transmitted. A 320×320-pixel frame is evaluated locally and discarded; what remains is the payload at right.
Every deployment publishes a public dashboard — hourly counts, speeds, directions, and environmental trends — with no subscription and no vendor lock-in, via the TrafficMonitor.ai project. The dashboards for dp-salal, dp-tuni, and dp-snowberry remain available to Depave and the public.
{
  "id": "1743788689.278871-vnfbe0",
  "camera": "picam_h264",
  "label": "bicycle",
  "top_score": 0.71484375,
  "start_time": 1743788689.278871,
  "end_time": 1743788697.271553,
  "entered_zones": ["zone_capture", "zone_far", "zone_radar"],
  "direction_calc": "inbound",
  "speed_calc": 10,
  "score": 0.82421875,
  "area": 104105,
  "position_changes": 1,
  "source": "frigate",
  "deployment_id": "1727678532209-4110962f-d"
}Data definitions
Timeframes
| Phase | Timeframe | Notes |
|---|---|---|
| Before plaza | Aug 1 – Aug 7, 2025 | Baseline; devices installed early August |
| Plaza active | Aug 8 – Sep 20, 2025 | Pop-up plaza installed |
| After plaza | Sep 21 – Nov 1, 2025 | Plaza removed; street returned to prior condition |
| Truck classification | Four weekdays, Jan 2026 | dp-salal only |
Days (n) in the ADT table reflects days with complete data per device (53–57) within the study period.
AI transparency
Objects are detected on-device with an open-source YOLO-family model (YOLOv9) running on an AI co-processor; speeds come from a certified Doppler radar, not from vision. Detection labels are mapped as follows:
- Bicycle — bikes and e-bikes
- Vehicle — cars, trucks, motorcycles, buses
- Pedestrian — person minus bicycle; may include scooters and other non-bicycle micromobility
Glossary
- ADT
- Average daily traffic: detection events for a mode divided by days with complete data.
- Detection event
- One object tracked from entry to exit of the camera’s field of view, with its zones, direction, and speed.
- Inbound / downhill
- Travel toward the plaza intersection from the north on 7th/Sandy, as seen from dp-salal (bearing N). Outbound is uphill.
- Zone
- A user-drawn region of the field of view (e.g. zone_north, zone_bike_refuge) used to derive direction and turning movements.
- dp-salal, dp-tuni, dp-snowberry
- Deployment identifiers for the three devices.
- Plaza phase
- Before, during (active), or after the temporary pop-up plaza installation.
- CSO
- Combined sewer overflow — untreated discharge during heavy rain that depaving helps reduce by infiltrating stormwater.
- FHWA class
- U.S. Federal Highway Administration vehicle classification by axle count and configuration, used for truck typing.
About us
Roadway Biome is the product line for TrafficMonitor.ai, an open-source smart-city traffic monitor built with commodity hardware to capture holistic roadway usage. Using edge machine-learning object detection and Doppler radar, it counts pedestrians, bicycles, and vehicles and measures their speeds — without storing a single image. Products are sold under Roadway Biome and manufactured by Green Dormer Solutions, LLC. Built with 💚 in Portland, Oregon.
Matt Zajack, founder, combines a background in mathematics and computer science with an M.S. in pharmacology and toxicology, and a commitment to sustainable, measurable impact.
About Depave
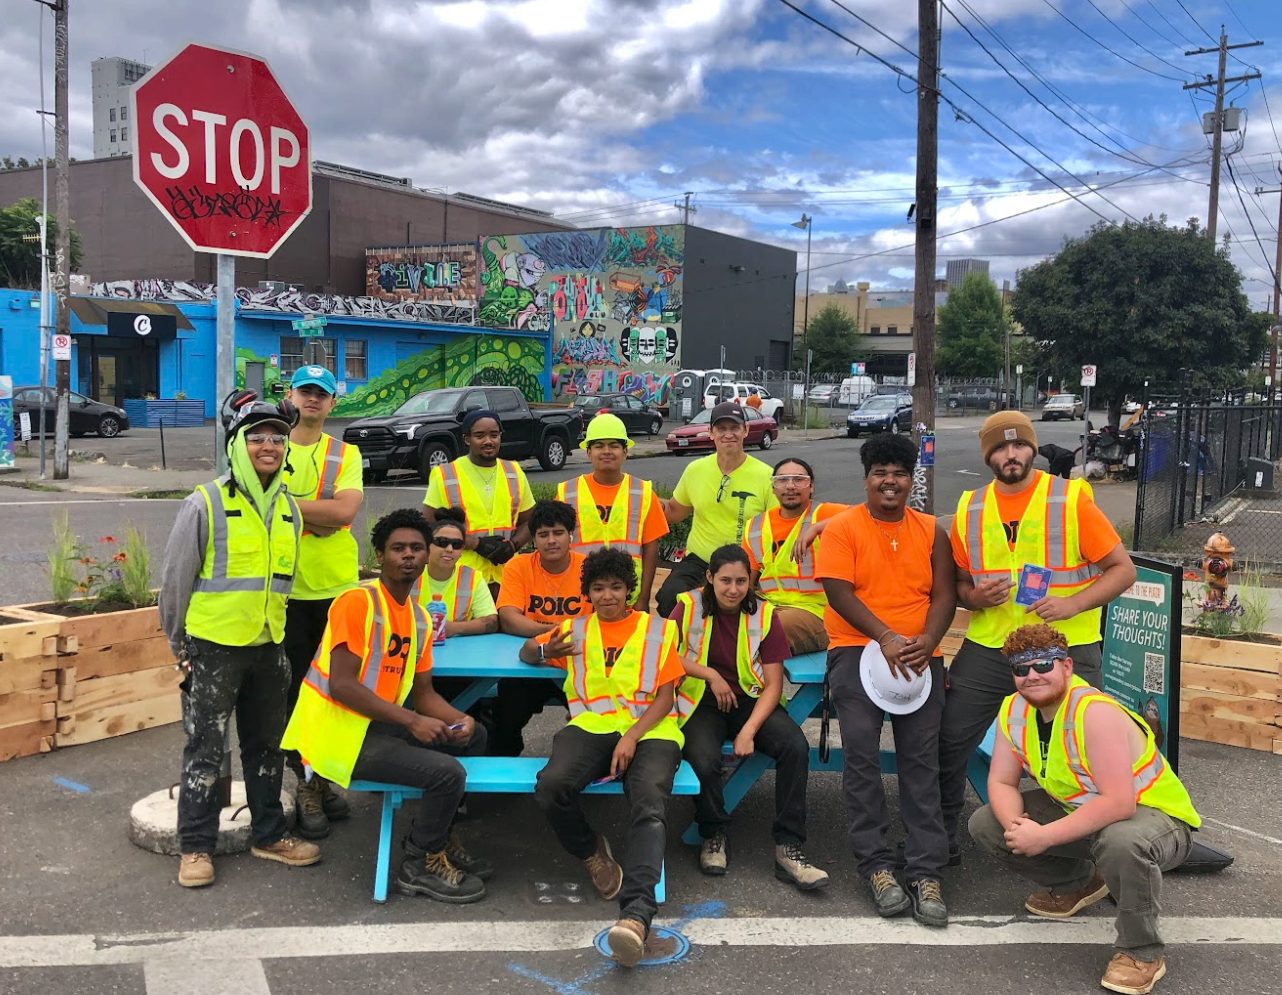
Depave is a Portland nonprofit with four staff, nine board members, and 500–600 volunteers a year that has transformed 82 paved sites — schoolyards, churches, businesses, nonprofit centers, and rights-of-way — into green space since 2008. Depave offers full-spectrum transformation: funding and grant writing, community design processes, landscape design, volunteer and public engagement, project management, and inclusive contracting. For the 7th & Sandy plaza, Depave is working with Zucker, KPFF, Mobycon, and Knot Studio.
References
- Depave. Future 7th & Sandy Green Plaza. depave.org
- TrafficMonitor.ai project — open-source traffic monitoring software and public deployment dashboards. trafficmonitor.ai
- Portland Bureau of Transportation. How we gather traffic counts. portland.gov
- U.S. DOT Federal Highway Administration. Vehicle classification scheme (FHWA 13-class).
- Roadway Biome. Depave 7th / Sandy Street Plaza, Summer 2025 — full analysis report, November 2025 (available on request).
Want to learn more?
See how other communities are using the Traffic Monitor to turn pop-ups into policy, or talk to us about measuring your own street.
From Pavement to Plaza: Traffic Data Shows Portland’s SE 7th & Sandy Pop-Up Plaza Boosted Cycling and Slowed Drivers While Vehicle Volumes Held Steady
Three rooftop Traffic Monitors, 57 days, more than a million roadway events — the evidence behind Depave’s Central Eastside green plaza.
An over-paved five-way intersection, and a vision to green it
The meeting of SE 7th Avenue, Sandy Boulevard, and Washington Street in Portland’s Central Eastside is roughly 85% impervious surface. It sits at the nexus of three High Crash Corridors, carries the 7th Avenue Neighborhood Greenway south from the Blumenauer Bridge, and sends vehicles downhill through an unclear, over-wide crossing where pedestrians, bicycles, scooters, and electric wheelchairs all share ambiguous space. The Central Eastside has some of the city’s hottest surface temperatures, among its least tree canopy, and little park access — even though it is zoned for dense housing.
Depave, the Portland nonprofit that has transformed 82 paved sites into green space since 2008, is leading an effort to turn the excess pavement into a green community plaza: traffic calming, placemaking, and stormwater infrastructure in one project, designed with businesses, nonprofits, designers, and City staff. In August 2025 Depave and partners installed a temporary pop-up plaza — painted surface, planters, and seating — to let the neighborhood try the idea before anything permanent is built.
Pop-ups are good at generating enthusiasm. They are less good at generating evidence. City bureaucracies don’t run on good vibes; they run on data. So Depave sponsored a Roadway Biome deployment to answer the question every tactical-urbanism project eventually faces: did it actually work?
Roadway Biome placed three TrafficMonitor.ai devices on nearby rooftops before the plaza went in, kept them running through the six-week pop-up, and left them in place for weeks after it came out. The result is a before/during/after record of every bicycle, pedestrian, and vehicle moving through the intersection — with radar speeds and air-quality readings alongside.
What Depave projects deliver. Rainwater infiltration that reduces combined sewer overflows and flooding; asphalt removed and tree canopy added, lowering surface temperatures people can feel and NASA can measure; volunteer events that build community; inclusive contracting for small businesses; and nature exposure in neighborhoods that have the least of it.
Watch the presentation
Matt Zajack walks through the study — the measurement problem, the deployment, and the bike-boom and calming-effect results — in the “From Pavement to Plaza” talk.
Privacy note: nothing is loaded from YouTube until you click play, and the video then plays from YouTube’s privacy-enhanced domain.
Eyes on the street: 57 days, three rooftops
In a single afternoon, three Traffic Monitors were installed on the roofs of private buildings — with each owner’s permission — giving overlapping views of the plaza intersection and a third view one block north at 7th & Stark, the busiest bicycle crossing in the area. Each device counts bicycles, pedestrians, and vehicles with on-device machine learning, measures speed with Doppler radar, tracks direction and turning movements through user-defined zones, and samples air quality every five minutes.
(Replace this block with the intern’s map.)
| Device | Host rooftop | View |
|---|---|---|
| 1 · dp-salal | Cookies | 7th/Sandy & Washington, SW corner, bearing N — looks downhill into the plaza intersection |
| 2 · dp-tuni | Next Adventure | 7th/Sandy & Washington, NE corner, bearing NW — overlapping field of view with dp-salal |
| 3 · dp-snowberry | Viking Steel | 7th & Stark, NE corner, bearing SW — one block north on the greenway |
dp-salal and dp-tuni watch the same intersection from opposite corners; their counts are not additive. Counts in this report are reported per device.
Data-driven insights: a holistic count of everyone using the street
Municipal decisions about street space usually rest on one number: the car count from a pneumatic tube laid across the road for a few days. That single metric says nothing about the people walking and biking through the same space, nothing about speed, and nothing about how behavior changes when the street changes. Over 57 days the three Traffic Monitors logged more than 1.4 million detection events across all modes, enough to compare phases of the plaza and weekday versus weekend patterns with statistical confidence.
At the plaza intersection (dp-salal), average daily traffic was 347 bicycles, 887 pedestrians, and 7,200 vehicles. One block north at 7th & Stark, pedestrian volumes were nearly three times higher (2,461 per day) and bicycles peaked at 480 per weekday — confirming the greenway’s role as a primary active-transportation corridor into the Central Eastside.
Average daily traffic (ADT) by device and plaza phase
| Mode | Days (n) | Detection events | ADT (overall) | ADT before plaza | ADT during plaza | ADT after plaza | ADT weekday | ADT weekend |
|---|---|---|---|---|---|---|---|---|
| dp-salal · 7th/Sandy & Washington (SW corner, bearing N) · Cookies | ||||||||
| Bicycle | 57 | 19,751 | 347 | 400 | 428 † | 264 | 382 ‡ | 264 |
| Pedestrian | 57 | 70,335 | 887 | 1,013 | 998 | 761 | 890 | 881 |
| Vehicle | 57 | 410,379 | 7,200 | 7,633 | 7,239 | 7,053 | 7,945 ‡ | 5,446 |
| dp-tuni · 7th/Sandy & Washington (NE corner, bearing NW) · Next Adventure | ||||||||
| Bicycle | 56 | 16,128 | 288 | 475 | 265 † | 254 | 305 | 245 |
| Pedestrian | 56 | 93,444 | 1,381 | 1,600 | 1,468 | 1,127 | 1,270 | 1,656 |
| Vehicle | 56 | 378,878 | 6,766 | 7,569 | 6,849 | 6,278 | 7,295 ‡ | 5,442 |
| dp-snowberry · 7th & Stark (NE corner, bearing SW) · Viking Steel | ||||||||
| Bicycle | 53 | 21,772 | 411 | 362 | 431 | 407 | 480 ‡ | 250 |
| Pedestrian | 53 | 152,227 | 2,461 | 292 | 2,880 † | 2,582 | 2,637 | 2,057 |
| Vehicle | 53 | 296,152 | 5,588 | 6,190 | 5,598 | 5,485 | 6,250 ‡ | 4,057 |
† Statistically significant difference (p ≤ 0.05) among plaza phases for the mode indicated. ‡ Statistically significant difference (p ≤ 0.05) between weekday and weekend for the mode indicated. Plaza active Aug 8 – Sep 20, 2025. dp-salal and dp-tuni fields of view overlap; counts are not additive.
Key findings: evidence that the plaza changed behavior
Insight 1 — The bike boom: if you build it, they will ride
Bicycle traffic at the plaza intersection was significantly higher while the plaza was in place than after it was removed: 428 versus 264 bicycles per day at dp-salal, a 62% difference. Vehicle volumes did not rise over the same period (7,239 during vs. 7,053 after), so the shift is not explained by a general increase in traffic. The device one block north at 7th & Stark recorded its highest bicycle counts during the plaza as well (431 per day).
The overlapping view from dp-tuni tells a more complicated story — it recorded its highest bicycle counts in the week before the plaza opened (475 per day) and similar volumes during and after. Because the two devices see the intersection from opposite corners and classify different approaches, the discrepancy is itself useful: it points to where riders were routing through the intersection, a question the turning-movement data below can answer.
Taken together, the plaza period shows the pattern transportation planners call induced demand for cycling: make a crossing feel safer and more people choose to ride through it.
Insight 2 — The calming effect: physical infrastructure changes speed
The speed limit on 7th/Sandy is 25 mph, and the intersection sits at the bottom of a downhill grade. With the plaza in place, 35% of vehicles exceeded 25 mph; after it was removed, 43% did. Every speed bin above 25 mph grew once the plaza came out, and the differences between the plaza and after-plaza phases are statistically significant. Bicycles followed the same pattern: 17% over 25 mph with the plaza, 23% without.
No enforcement, no signage campaign — paint, planters, and a narrower effective crossing were enough to move the distribution. That is the behavioral evidence advocates usually cannot produce for a temporary installation.
35% of vehicles > 25 mph43% of vehicles > 25 mph- Vehicles were not displaced. Daily vehicle volumes at the plaza intersection stayed within a few percent across all three phases (7,633 → 7,239 → 7,053). The plaza calmed traffic without pushing it elsewhere.
- Weekday commuting dominates bicycle use. Bicycles ran 382 per weekday vs. 264 per weekend day at the plaza, and 480 vs. 250 at 7th & Stark — a statistically significant commuter pattern that favors long-term, every-day investments over event programming.
- Downhill is where the risk is. Coming downhill through the intersection, 46% of vehicles and 23% of bicycles exceeded 25 mph; uphill, 21% and 11%. Any permanent design should concentrate its calming on the downhill approach.
- Pedestrian volumes point north. 7th & Stark carried ~2,500 pedestrians per day during the study, with weekend volumes at nearly 80% of weekday levels. The plaza block connects to a corridor people already walk.
Vehicle speed is the primary safety threat
Across the full study, 39% of all vehicles at dp-salal exceeded the 25 mph limit, and 3% exceeded 30 mph — roughly 200 vehicles every day traveling at speeds where a pedestrian struck has a substantially higher chance of fatal injury. Radar-measured speeds are captured for every detected object, so the same tables can be produced for bicycles, by direction, by phase, or by hour.
Speed distribution by plaza phase (dp-salal)
| mph | Bicycle (% of 13k) | Vehicle (% of 344k) | ||||
|---|---|---|---|---|---|---|
| Before | Plaza active | After | Before | Plaza active | After | |
| <10 | 9% | 26% * | 17% * | 7% | 5% | 5% |
| 10–15 | 18% | 14% * | 17% * | 6% | 6% | 6% |
| 15–20 | 20% | 16% | 16% | 10% | 13% * | 10% * |
| 20–25 | 32% | 27% | 27% | 39% | 42% * | 36% * |
| 25–30 | 20% | 15% * | 21% * | 35% | 32% * | 39% * |
| 30+ | 1% | 2% | 2% | 3% | 3% * | 4% * |
Percent of each mode in each speed bin during each phase. * Statistically significant difference between the plaza-active and after-plaza phases within that speed bin for that mode. Shaded rows are over the 25 mph limit.
Speed distribution by direction (dp-salal, full study)
| mph | Bicycle (% of n) | Vehicle (% of n) | ||
|---|---|---|---|---|
| Downhill (8.6k) | Uphill (3.7k) | Downhill (252k) | Uphill (98k) | |
| <10 | 14% | 36% | 5% | 6% |
| 10–15 | 16% | 15% | 4% | 11% |
| 15–20 | 17% | 16% | 7% | 20% |
| 20–25 | 30% | 22% | 37% | 43% |
| 25–30 | 21% | 10% | 42% | 19% |
| 30+ | 2% | 1% | 4% | 2% |
Downhill is inbound toward the plaza intersection (bearing N from dp-salal). Overall, 46% of vehicles and 23% of bicycles exceeded 25 mph coming downhill. Shaded rows are over the 25 mph limit.
Overall speed distribution (dp-salal, full study)
| mph | Bicycle | Vehicle |
|---|---|---|
| <10 | 21% | 5% |
| 10–15 | 16% | 6% |
| 15–20 | 16% | 11% |
| 20–25 | 28% | 39% |
| 25–30 | 18% | 36% |
| 30+ | 2% | 3% |
Percent of each mode in each speed bin across all 57 days. Shaded rows are over the 25 mph limit.
Time-of-day and weekday/weekend patterns
Bicycles behave like commuters. On weekdays, 15% of all bicycle volume — 30% of inbound (downhill) trips — passes between 8 and 10 am, and the outbound (uphill) peak at 4–6 pm carries 35% of outbound trips. Weekend bicycle traffic is lower and spread across the day.
Vehicles are steady all day. Volumes are fairly even across weekday hours with only a slight skew toward the 4–6 pm peak, and weekends run roughly 30% lighter. For a plaza that will reallocate space from vehicles to people, that flat profile matters: there is no single hour where the street is at capacity.
Movement and turning patterns
Every detection records the zones an object entered and in what order, so turning movements come for free. Patterns Depave’s design team can now investigate include use of the bike refuge on 7th/Sandy at Washington by northbound bicycles, the volume of vehicle turns into Washington from both directions on 7th/Sandy, and bicycle cross-traffic at 7th & Stark — the highest-volume bicycle crossing in the study.
The freight factor: measuring industrial friction instead of arguing about it
The Central Eastside is an industrial sanctuary, and any change to its streets raises the question of truck access. Rather than debate it, Roadway Biome classified every vehicle by truck type using U.S. DOT Federal Highway Administration classes over four weekdays in January 2026 and mapped each one’s turning movement through the intersection.
On a typical weekday (Jan 6, 2026), 6,227 vehicles passed dp-salal. Medium and large trucks — box trucks, delivery vans, and bigger — numbered 165, about 2.5%. Only about 5% of all turning movements (about 6% of truck movements) would be affected by the proposed plaza design. That works out to roughly nine large trucks per day making a movement the design would change.
We spend all this time and design worried about nine large trucks per day?Roadway Biome, “From Pavement to Plaza” presentation, 2026
From the planning question to a measured answer took one day with one device. Freight concerns are legitimate; now they are also quantified, and the design can accommodate the handful of movements that matter.
| Truck type | Label | FHWA description |
|---|---|---|
| Large | large | Class 7–8 tractors |
| Medium | med | Class 4–8 straight trucks |
| Small | sm | Class 2b–3 |
| Non-truck | na | < Class 2b |
Environmental justice: it’s not just traffic, it’s the air
Each Traffic Monitor carries an environmental sensor stack sampled every five minutes: a PMS5003 particulate sensor (PM1, PM2.5, PM10), a MICS6814 gas sensor (reductive, oxidative, and ammonia gases), and a BME280 for temperature, pressure, and humidity. A MEMS microphone for noise is on board but was not enabled for this study.
Because the readings sit next to the vehicle counts in the same dataset, air quality can be read against traffic directly. Even the first look raises questions worth pursuing: how PM2.5 trends relate to the daily vehicle peaks, and an apparent overnight upsurge in oxidative gases that traffic alone would not explain. The full environmental analysis is pending; the data are already public on the device dashboards.
The value of rapid, affordable, holistic data collection
Municipal street reallocations often fall into what we call the single-metric trap: traditional pneumatic tube counters prioritize car volumes, so car volume becomes the only thing the decision can weigh. Tactical urbanism, meanwhile, relies on good feelings — photos of a busy pop-up and a stack of comment cards. Neither moves a bureau.
This study shows a replicable alternative. Three sites were set up in one afternoon. The entire implementation cost less than $3,000 for long-term monitoring. Each device captured roughly half a million events in 57 days with minimal intervention. And the output is granular, event-level, de-identified data that Depave, the City, and the public can all inspect — not a summary PDF from a consultant.
The advocacy loop
Strategic advocacy requires moving beyond simple counts to the behavioral shifts that prove a safety intervention worked. For SE 7th & Sandy, those shifts are now on the record: more cycling, slower driving, no loss of vehicle access, and a freight impact small enough to design around. Future work with Depave includes community activation around the data and continued monitoring as the permanent plaza design moves forward.
Methodology
Study design
Three TrafficMonitor.ai devices were installed on private rooftops with owner permission: Viking Steel at 7th & Stark (dp-snowberry), Cookies at 7th/Sandy & Washington (dp-salal), and Next Adventure at 7th/Sandy & Washington (dp-tuni). Data available from each device: object counts, direction and zone transitions, radar speeds, and air quality.
Timeframes
Study period Aug 1 – Nov 1, 2025; plaza active Aug 8 – Sep 20, 2025. Phases are compared as before, during, and after the plaza. Truck classification was run over four weekdays in January 2026. Statistical significance is reported at p ≤ 0.05.
Ground truth and fine-tuning
Citizen-science confirmation counts were performed on site by a volunteer (Ted) and compared with each device over the same window. Vehicle counts matched closely; bicycle and person counts diverged at the overlapping-view intersection, and those sessions were used to adjust detection zones, object thresholds, and minimum scores before the analysis was run — including the zone edits that enabled the turning analysis.
| Session | Counter | Bicycle | Person | Vehicle |
|---|---|---|---|---|
| 7th/Sandy & Washington | Ted (human) | 28 | 4 | 158 |
| dp-tuni | 15 | 20 | 155 | |
| dp-salal | 13 | 7 | 154 | |
| 7th & Stark | Ted (human) | 7 | 3 | 62 |
| dp-snowberry | 4 | 5 | 62 |
Roadway Biome capabilities: privacy by design
The Traffic Monitor is open source, glass-box, and repairable. Object detection runs on the device itself (edge inference), and only a de-identified event record leaves it: object class, time, zones entered, direction, and radar speed. No images, video, license plates, or faces are stored or transmitted. A 320×320-pixel frame is evaluated locally and discarded; what remains is the payload at right.
Every deployment publishes a public dashboard — hourly counts, speeds, directions, and environmental trends — with no subscription and no vendor lock-in, via the TrafficMonitor.ai project. The dashboards for dp-salal, dp-tuni, and dp-snowberry remain available to Depave and the public.
{
  "id": "1743788689.278871-vnfbe0",
  "camera": "picam_h264",
  "label": "bicycle",
  "top_score": 0.71484375,
  "start_time": 1743788689.278871,
  "end_time": 1743788697.271553,
  "entered_zones": ["zone_capture", "zone_far", "zone_radar"],
  "direction_calc": "inbound",
  "speed_calc": 10,
  "score": 0.82421875,
  "area": 104105,
  "position_changes": 1,
  "source": "frigate",
  "deployment_id": "1727678532209-4110962f-d"
}
Data definitions
Timeframes
| Phase | Timeframe | Notes |
|---|---|---|
| Before plaza | Aug 1 – Aug 7, 2025 | Baseline; devices installed early August |
| Plaza active | Aug 8 – Sep 20, 2025 | Pop-up plaza installed |
| After plaza | Sep 21 – Nov 1, 2025 | Plaza removed; street returned to prior condition |
| Truck classification | Four weekdays, Jan 2026 | dp-salal only |
Days (n) in the ADT table reflects days with complete data per device (53–57) within the study period.
AI transparency
Objects are detected on-device with an open-source YOLO-family model (YOLOv9) running on an AI co-processor; speeds come from a certified Doppler radar, not from vision. Detection labels are mapped as follows:
- Bicycle — bikes and e-bikes
- Vehicle — cars, trucks, motorcycles, buses
- Pedestrian — person minus bicycle; may include scooters and other non-bicycle micromobility
Glossary
- ADT
- Average daily traffic: detection events for a mode divided by days with complete data.
- Detection event
- One object tracked from entry to exit of the camera’s field of view, with its zones, direction, and speed.
- Inbound / downhill
- Travel toward the plaza intersection from the north on 7th/Sandy, as seen from dp-salal (bearing N). Outbound is uphill.
- Zone
- A user-drawn region of the field of view (e.g. zone_north, zone_bike_refuge) used to derive direction and turning movements.
- dp-salal, dp-tuni, dp-snowberry
- Deployment identifiers for the three devices.
- Plaza phase
- Before, during (active), or after the temporary pop-up plaza installation.
- CSO
- Combined sewer overflow — untreated discharge during heavy rain that depaving helps reduce by infiltrating stormwater.
- FHWA class
- U.S. Federal Highway Administration vehicle classification by axle count and configuration, used for truck typing.
About us
Roadway Biome is the product line for TrafficMonitor.ai, an open-source smart-city traffic monitor built with commodity hardware to capture holistic roadway usage. Using edge machine-learning object detection and Doppler radar, it counts pedestrians, bicycles, and vehicles and measures their speeds — without storing a single image. Products are sold under Roadway Biome and manufactured by Green Dormer Solutions, LLC. Built with 💚 in Portland, Oregon.
Matt Zajack, founder, combines a background in mathematics and computer science with an M.S. in pharmacology and toxicology, and a commitment to sustainable, measurable impact.
About Depave
Depave is a Portland nonprofit with four staff, nine board members, and 500–600 volunteers a year that has transformed 82 paved sites — schoolyards, churches, businesses, nonprofit centers, and rights-of-way — into green space since 2008. Depave offers full-spectrum transformation: funding and grant writing, community design processes, landscape design, volunteer and public engagement, project management, and inclusive contracting. For the 7th & Sandy plaza, Depave is working with Zucker, KPFF, Mobycon, and Knot Studio.
References
- Depave. Future 7th & Sandy Green Plaza. depave.org
- TrafficMonitor.ai project — open-source traffic monitoring software and public deployment dashboards. trafficmonitor.ai
- Portland Bureau of Transportation. How we gather traffic counts. portland.gov
- U.S. DOT Federal Highway Administration. Vehicle classification scheme (FHWA 13-class).
- Roadway Biome. Depave 7th / Sandy Street Plaza, Summer 2025 — full analysis report, November 2025 (available on request).
Want to learn more?
See how other communities are using the Traffic Monitor to turn pop-ups into policy, or talk to us about measuring your own street.