Traffic Data Reveals River View Cemetery as a Crucial Corridor for Portland Bicyclers and Vulnerable Road Users
The River View Cemetery (RVC) route has long served as a vital, though precarious, connection for thousands of Portland commuters and recreational users—linking the waterfront, downtown, and Sellwood to Southwest Portland and Lewis & Clark College. For decades, this private property has acted as a de facto public connector, allowing the City of Portland to avoid creating a safe, public, all-weather route for a critical transportation link. The present traffic monitoring study and recurring, unexpected closures have underscored the urgency for the City of Portland to act on a safe, public, and all-weather alternative.
To move the conversation forward from anecdote to evidence, Lewis & Clark College partnered with River View Cemetery to commission a data-driven analysis of the route's usage. My company, Green Dormer Solutions, LLC, provided pro bono traffic monitoring using the open-source TrafficMonitor.ai device. The goal was to provide traffic advocates, city councilors, and transportation planners with objective evidence to justify the creation of a safe, public route.
Data-Driven Insights: Quantifying RVC's Essential Role
Data was collected over a 36-day period, split between Summer (August 15-28, 2025) and Autumn (September 19-October 10, 2025), at the Macadam entrance gate. The analysis revealed significant and consistent use, highlighting the route’s essential role for active transit, especially for those making the challenging ascent to the Southwest Portland neighborhoods. Highlighted are the route’s essential role for active transit, particularly for uphill travel, but also highlights the intrusion of motor vehicle traffic.
User Type | Average Daily Traffic (ADT) , Count | Weekday ADT | Weekend ADT | Exiting Cemetery (Downhill) ADT | Entering Cemetery (Uphill) ADT |
|---|---|---|---|---|---|
Bicycles | 330 | 313 | 344 | 103 | 201 † |
Pedestrians | 90 | 81 | 87 | 76 | 23 † |
Vehicles | 88 | 96 | 53† | 57 | 30 † |
† Indicates statistically significant difference in comparison (p<=0.0.5)
Key Findings from the Analysis: Evidence for Public Investment
The data provides a clear picture of why a public alternative is critically needed, supporting the arguments made by advocates for years.
Bicycle Reliance and Commuting:
High Volume and Consistent Use: Bicycles account for the largest volume of users, with 330 daily average counts. Importantly, the volume showed no statistically significant difference between weekdays (313) and weekends (344), illustrating consistent reliance for both commuting and recreation. This confirms that RVC is a crucial link for transportation, not just a recreational trail.
Directional Travel: Significantly more bicycles were recorded entering (uphill) the cemetery than exiting (201 vs. 103). This strong directional trend suggests the cemetery route is a preferred, safer path for the challenging climb to the Southwest Portland neighborhoods, as alternatives like Taylor's Ferry Road are perceived as dangerous.
Group Rides: An average of 3.2 "group rides" (clusters of at least 5 bicycles) occur per day, with 79% of these groups traveling uphill. This further solidifies the route’s importance for the challenging ascent.
Commuter vs. Cut-Through Traffic: While bicycle volume was evenly distributed after 8 am, with a slight bump from 4-6 pm on weekdays, vehicle volume showed a statistically significant higher volume on weekdays (96 daily average) compared to weekends (53 daily average). Vehicle traffic concentrated near the evening commute, with 34% of vehicles traveling from 4-6 pm on weekdays. This indicates the cemetery is being used as a vehicle cut-through route, increasing conflict points with active transit users and cemetery visitors.
Safety is a Critical Concern:
Extreme Speeding: The speed limit in RVC is 15 mph. The data showed that 66% of vehicles and 15% of bicycles were captured moving over this limit. Vehicles, in particular, showed an average speed of 17 mph downhill, with seasonal analysis showing a statistically significant increase in cars driving 20-30 mph in autumn. The speeding vehicle cut-through traffic creates a high-risk environment on private roads that were never designed for this volume and speed, directly contributing to the cemetery's liability concerns.
Comparison to Alternatives: The primary public alternative, Taylor’s Ferry Road, has an Average Daily Traffic (ADT) of over 5,560 westbound vehicles with an 85th percentile speed of 49 mph (posted 35 mph limit), making it unsafe for bicycles and pedestrians. The data confirms the high volume of bicycle traffic relies on RVC precisely due to the unsafe nature of alternatives.

Direction of Travel: The Crucial Uphill/Downhill Divide
The data highlights the cemetery's critical function as a connection for cyclists traveling uphill toward Lewis & Clark College, the Terwilliger Parkway area, and Southwest neighborhoods as well as potential recreational and training rides.
Overall, there were significantly more bicycles entering the cemetery (going uphill) versus exiting (going downhill) at a ratio of 201 to 103 bicycles ADT. This is a powerful finding, as the most challenging and dangerous alternative, S Taylors Ferry Rd, is primarily an uphill/eastbound slog with an 85th percentile speed of 44 mph (in a 35 mph zone) and high Average Daily Traffic (ADT) counts of over 6,000.1
The opposite trend was observed for vehicles and pedestrians, with more exiting (downhill) than entering, indicating that drivers see the cemetery as a viable link for downhill travel as high-speed cut-through to avoid potential congestion on Taylor’s Ferry or Macadam. This also creates more potential conflict, as daily pedestrian count is slightly higher than vehicles, at 90 vs 88 ADT, and all user activity increases during the evening commute time.
Vehicle Speed is the Primary Safety Threat
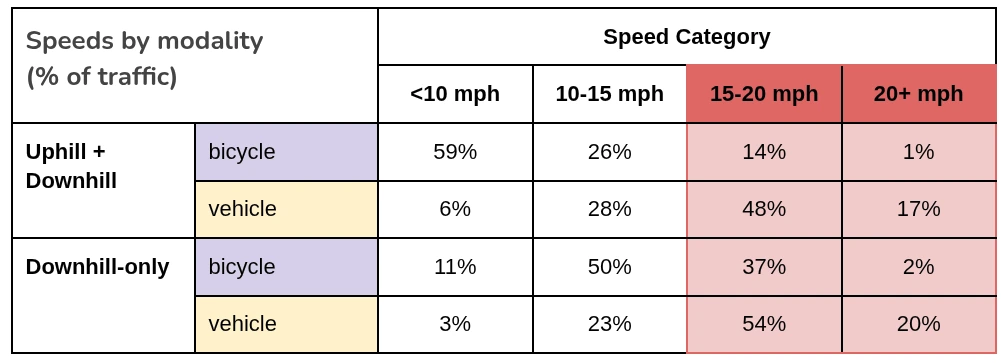
The most alarming discovery relates to speed. The speed limit within River View Cemetery is 15 mph. The data clearly shows that vehicles are routinely exceeding this limit, posing a direct threat to all other users.
66% of vehicles were captured moving over 15 mph (the speed limit), compared to just 15% of bicycles.
This speed differential is magnified when traveling downhill: 74% of vehicles vs. 39% of bicycles were over 15 mph.
Vehicles maintained a high average speed regardless of direction: 15 mph uphill vs. 17 mph downhill.
Bicycles, by contrast, had a major directional speed difference: 7 mph uphill vs. 14 mph downhill.
This confirms that the cemetery's roads are being treated as a high-speed, non-residential street by most drivers, directly contrasting with the intended quiet nature of a cemetery and the safety needs of active transportation users. The risks are compounded by the presence of vulnerable road users and the narrow, winding nature of the roads.
Seasonal and Time-of-Day Analysis
The analysis also looked at seasonal and hourly variations, offering a more nuanced view of usage.
Seasonality
User Type | Summer Daily Average | Autumn Daily Average | Difference (Summer vs. Autumn) |
|---|---|---|---|
Bicycles | 386 | 294† | † 24% reduction (Significant) |
Vehicles | 91 | 83 | No significant difference |
Pedestrian | 83 | 91 | No significant difference |
While overall bicycle counts saw a significant 24% reduction in autumn compared to summer—a common trend potentially due to weather—vehicle counts remained essentially the same. This suggests that the volume of cut-through motor traffic is consistent regardless of the season, further highlighting the urgency of finding a safe public alternative. It is worth noting that weekend bicycle counts remained consistent between summer and autumn with 367 vs 370 ADT, respectively.
Furthermore, the data showed that vehicles were significantly faster in autumn than in summer, with more cars driving 20-30 mph. This increase in speed, despite lower overall bicycle volume, is a dangerous trend that increases risk for all users as the days get shorter and weather worsens.
Hourly Breakdown

The hourly breakdown points directly to the cemetery's function as a bicycle commuter route:
Bicycle volume was evenly distributed throughout the day after 8 am, with a notable weekday bump of 21% of total volume occurring during the crucial 4-6 pm evening window.
Vehicle volume was highly concentrated during the afternoon rush hour, with 34% of vehicles traveling through the cemetery from 4-6 pm on weekdays.
This convergence of high-speed motor vehicle traffic with peak bicycle and pedestrian commuter traffic creates a predictable and unacceptable safety hazard precisely when vulnerable users need the route most.
Group Riding
The analysis also shed light on group cycling, which has been a point of contention with the cemetery users. Group rides were defined as at least five bicycles clustered within 10 seconds and had no way of differentiating recreational or commuter rides.
There is an average of 3.2 "group rides" per day, nearly even on weekdays and weekends.
Group rides make up an average of 8% of total daily bicycle volume, averaging 10 bicycles per group.
79% of group rides go uphill, further cementing the cemetery's role as the only feasible route for ascending the hill.
Weekday group rides skew towards evening (5-7pm) and weekend group rides skew toward morning (9-10 am)
Specifically, weekday morning commuter group rides, largely uphill, are likely a result of a "platoon" effect caused by the traffic light at Mcadam's grouping cyclists as they commence the ascent toward the cemetery.
The Alternative Route Crisis
The precarious nature of the cemetery access was recently thrust into the spotlight with temporary closures due to construction, prompting a familiar outcry from the community. A recent BikePortland article, "Yes, River View Cemetery is closed to cycling. Here's why," reported temporary, safety-related restrictions and the inability of the cemetery to provide prior warnings due to outside contractors and weather concerns.
Comparing Routes: RVC is the Only Safe Option

The data provided by the analysis confirms that the alternatives are significantly longer, steeper grades, and often unsafe.
Route Segment | Via River View Cemetery | Via Terwilliger Blvd | Via S Macadam Ave* |
|---|---|---|---|
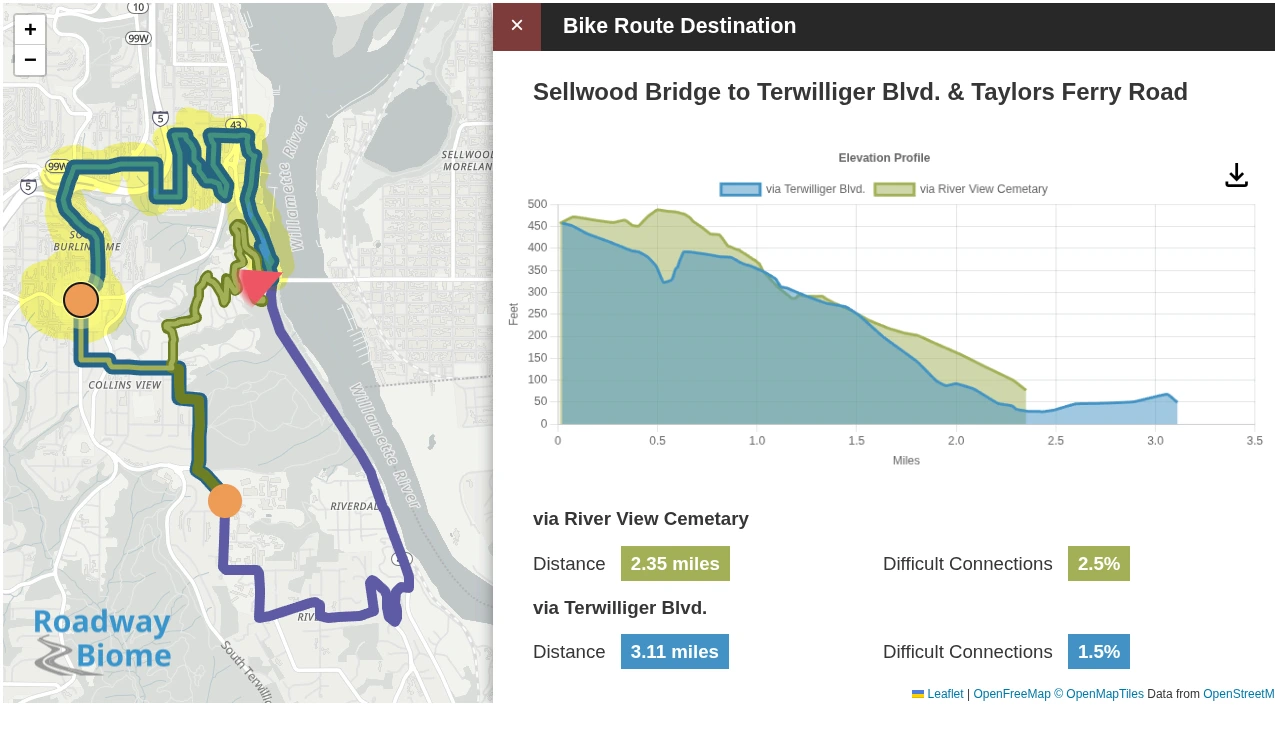
Sellwood Bridge to Terwilliger Blvd | 2.1 miles | 2.8 miles (33% increase) | N/A |
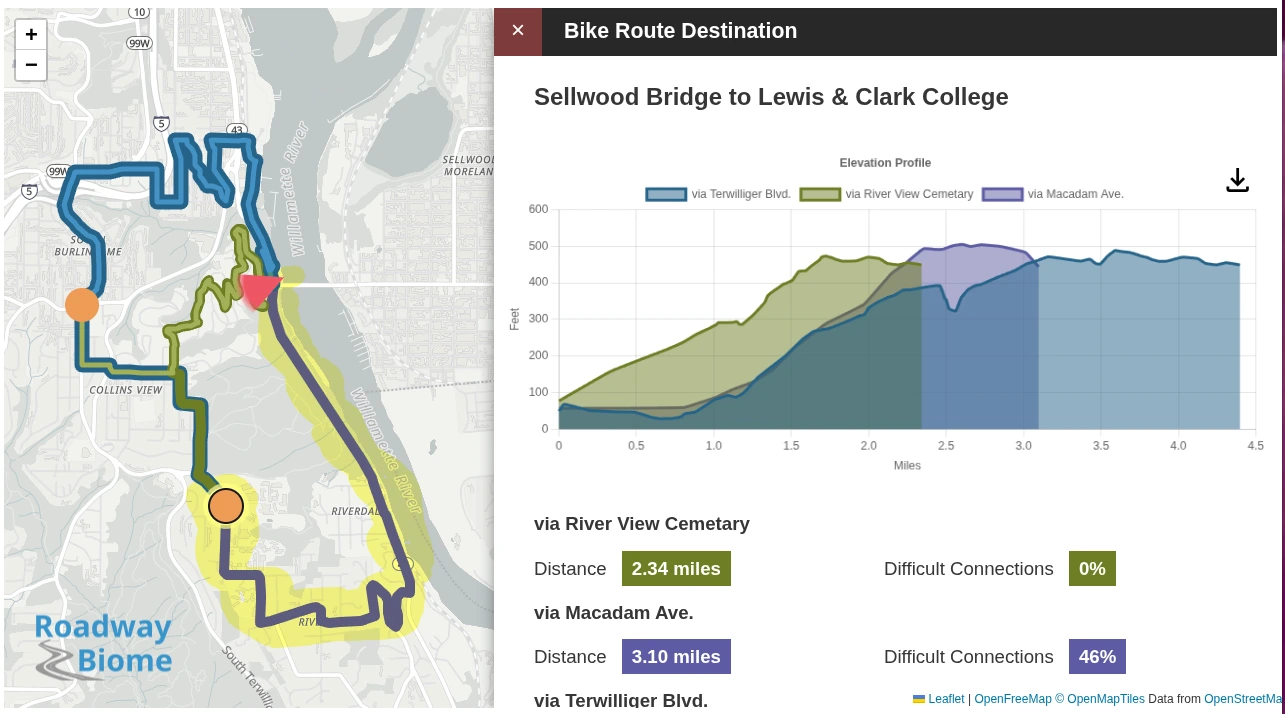
Sellwood Bridge to Lewis & Clark College | 2.4 miles | 3.9 miles (63% increase) | 3.1 miles (29% increase) |
*The S Macadam Ave route is listed as a "Difficult Connection." 2
The most direct alternative, S Taylors Ferry Rd, is not a designated bicycle route. As commenters on the BikePortland article noted, it is a high-speed, high-traffic environment where the only way to feel safe descending is to take the lane at a speed nearing traffic, an option only for the "strong and fearless." The fact that the 85th percentile speed on Taylors Ferry is 49 mph westbound and 44 mph eastbound—far exceeding the 35 mph posted limit—makes it a dangerous prospect for most cyclists.
Sellwood Bridge to Terwilliger Blvd. & Taylors Ferry Road via Terwilliger Blvd is 33% longer than using River View Cemetery. This route was chosen because Taylor's Ferry Road itself is not designated a bicycle route.
Sellwood Bridge to Lewis & Clark College via Macadam Ave is 63% longer, of which 46% is along roads labeled as "difficult connections".
The Value of Rapid, Affordable Data Collection
The data are clear. The predicament presented by the roadway data—high-speed motor vehicles, peak commuter traffic, and the ever-present threat of closure—deserves immediate and concrete action. While the discussion is often complicated by philosophical debates over private property, tax exemption, and the sanctity of cemeteries, the core issue remains: There is no safe, public, guaranteed, and direct connection for active transit and non-vehicular users between the Sellwood Bridge area and SW Portland.
The comprehensive traffic and speed data, focused on holistic roadway data–not just car-centric numbers, and collected over a six-week period, is crucial for informing stakeholders—including Lewis & Clark College, RVC, and Portland City Council District 4 representatives. This fact-based approach is vital for making decisions that ensure the safety and connectivity of the community, especially for vulnerable road users.
The reality is that city agencies often face capacity constraints. Despite Taylor’s Ferry Road being designated as a high motor vehicle collision road, the City of Portland's transportation bureau (PBOT) has been asked to deploy traffic counters in the past but has not had the capacity to do so. Furthermore, as shown by the RVC analysis, a few hours or days of counting would not have had the ability to showcase the rich data captured and presented here, especially the distinct trends between weekdays and weekends, and uphill vs. downhill speeds. The long-term trend data is essential for accurate policy decisions.
The deployment of the TrafficMonitor.ai device highlights how communities and advocates can gather the robust data they need to spur action.
Methodology
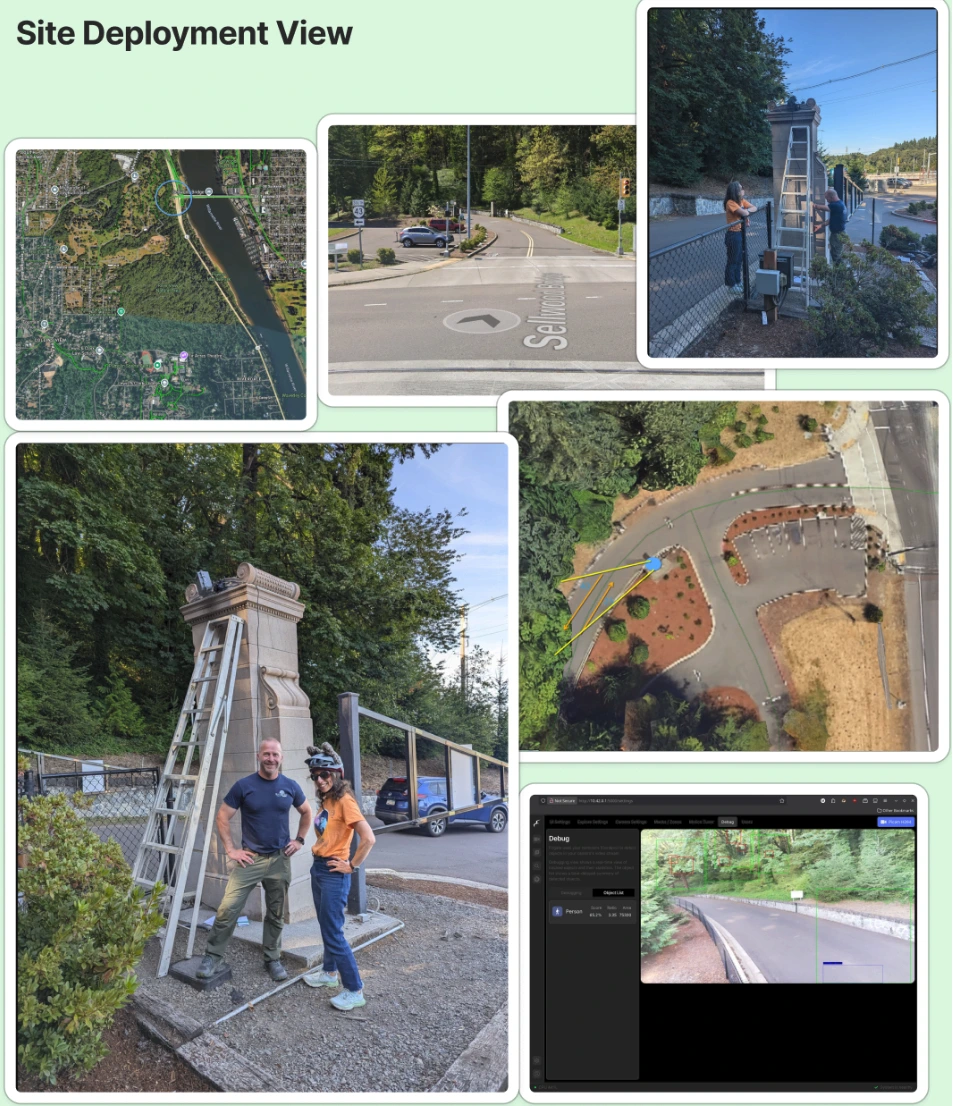
The data was collected at one point: the cemetery entrance gate near the Sellwood Bridge, using a trafficmonitor.ai device—an open-source smart city traffic monitoring solution utilizing edge machine learning object detection and Doppler radar that is built right here in PDX for citizen scientists, advocates, and engineers. Collecting this rich data—including object counts, speed, and directional travel—was accomplished quickly, affordably, with little intervention and no impact on roadway users or staff. This data collection study was estimated at less than $1,000 to implement. Comparable private counting and speed analysis on a multi-modal route often costs upwards of $29,000.
Roadway Biome Capabilities
Roadway Biome builds and utilizes the trafficmonitor.ai system that prioritizes privacy. The device uses local object detection inferencing and Doppler radar, not capturing or storing identifying visuals (no images, license plates, or faces). It only records the object class (bicycle, vehicle, pedestrian), times, speed, and direction for fully local data de-identification. This ensures ethical, granular, and holistic data collection on traffic patterns for urban planning, without compromising user identity or personal information.
Data Definitions
Category | Timeframe | Duration |
|---|---|---|
Summer | Aug 15-28, 2025 | 14 days |
Autumn | Sep 19-Oct 10, 2025 | 22 days |
Object detection labels and classification:
AI Transparency disclosure: This analysis utilized the public domain Coral SSDLite MobileDet based on the public domain COCO dataset with the following labels:
Bicycle: combined ebikes, bikes
Vehicle: combined cars, trucks, motorcycles
Pedestrian: person (minus) bicycle (may include scooters and non-bicycle micro-mobility)
Glossary of terms:
ADT, Average Daily Traffic; volume of traffic for specified object
RVC, River View Cemetery
Uphill and Downhill directions refer to travel into and out of the cemetery from Macadam’s, respectively (westbound and eastbound)
About us
RoawayBiome.com is the marketed product featuring TrafficMonitor.ai, the Traffic Monitor, is an open source smart city traffic monitoring software built with commodity hardware to capture holistic roadway usage. Utilizing edge machine learning object detection and Doppler radar, it counts pedestrians, bicycles, and cars and measures vehicle speeds.
The device was conceived, designed, and is built right here in Portland, OR by Matt Zajack of Green Dormer Solutions, LLC. You can learn more about the product and services at www.roadwaybiome.com and the previous BikePortland coverage.
References:
https://www.portland.gov/transportation/traffic-operations/how-we-gather-traffic-counts interactive map for S Taylors Ferry Rd E of 2nd Ave, Dec 2020
https://www.portland.gov/transportation/walking-biking-transit-safety/bike-and-walk-maps-portland